


Given that hypoalbuminemia tends to result in higher free fraction concentrations of valproic acid, different methods have been developed to determine the latter in patients with this condition. The aim of this study is to assess the reliability of these methods and, if necessary, design a new estimation method.
MethodA retrospective analysis was carried out by the Pharmacy Department of Severo Ochoa University Hospital of admitted patients with at least one trough concentration of valproic acid between October 2017 and February 2019. The estimation methods used were those developed by Kodama, Hermida, Doré, as well as a new method proposed in the study. A total of 17 serum valproic acid concentrations were used to determine the free fraction of valproic acid with each method; the values obtained were compared with the results obtained following laboratory determinations. Accuracy and precision were calculated using mean error and root mean square error, respectively.
ResultsThe comparison between observed and predicted free valproic acid values using the methods under investigation showed that the method proposed in this study provides the highest reliability as it presents the highest accuracy and precision. The worst results were those obtained using the Kodama method, which does not consider albuminemia, an essential variable that determines the concentration, therapeutic effect and toxicity of valproic acid.
ConclusionsGiven that the method proposed in this study proved to be superior to the other methods analyzed, we believe it can be reliably used to estimate free valproic acid levels in patients with hypoalbuminemia.
La fracción de ácido valproico libre aumenta en pacientes con hipoalbuminemia. Se han publicado diferentes métodos para su estimación. El objetivo de este estudio es valorar la fiabilidad de dichos métodos en nuestra población y proponer un nuevo método de estimación.
MétodoAnálisis retrospectivo realizado por el Servicio de Farmacia del Hospital Universitario Severo Ochoa en pacientes ingresados entre octubre de 2017 y febrero de 2019 con al menos una concentración valle de ácido valproico. Los métodos de estimación empleados fueron los de Kodama, Hermida, Doré y un nuevo método propuesto, diseñado por García. A partir de 17 mediciones de ácido valproico se comparó el ácido valproico libre estimado con cada método y el obtenido en el laboratorio. Se calcularon la exactitud y la precisión mediante el error medio y el error cuadrático medio, respectivamente.
ResultadosLa comparación entre los valores observados y predichos de ácido valproico libre por los distintos métodos evaluados pone de manifiesto que el de mayor fiabilidad es el diseñado por García, al presentar la mejor exactitud y precisión. Los peores resultados son los del método Kodama, al no considerar la albuminemia, variable fundamental que condiciona la concentración, el efecto terapéutico y la toxicidad de este fármaco.
ConclusionesEl método diseñado por García ha demostrado ser mejor que otros métodos, por lo que puede ser propuesto para estimar con fiabilidad el ácido valproico libre en pacientes con hipoalbuminemia, aunque se precisa aplicarlo en un mayor número de pacientes para confirmar su utilidad.
Valproic acid (VPA) is a drug that is widely used to treat various types of epilepsy as well as bipolar disorder and certain neurologic conditions such as migraine and neuropathic pain1–3. VPA exerts its pharmacological effect through multiple mechanisms, among them an increase in the production of gamma-aminobutyric acid (GABA), a decrease in the synthesis of glutamate, and a blockade of voltage-gated sodium channels and T-type calcium channels4. Around 90% of VPA is bound to plasma proteins, chiefly albumin. This bond is dose-dependent and saturable which, together with VPA's narrow therapeutic margin and high pharmacokinetic variability, warrants close monitoring of its plasma levels1,5.
Most commonly, it is the concentration of total valproic acid (TVPA) that gets measured. However, in cases where the binding of VPA is weaker, an increase is observed in the free fraction of the valproic acid (FVPA) in plasma. This means that a higher concentration of the drug becomes available to exert its pharmacological effect which, however, also increases the risk of toxicity. The most usual adverse reactions are nausea and vomiting, drowsiness, tremor, confusion, weight gain, hyperammonemia and elevated liver enzyme levels1. Patients with hypoalbuminemia should have their free FVPA concentrations monitored, although VPA's therapeutic margin has not been clearly defined with different authors proposing different criteria6–8. As the free FVPA is currently not subject to routine determinations, several mathematical equations have been proposed to estimate it, based on albuminemia and TVPA9–12.
Hermida et al.9 proposed a method to predict free FVPA concentrations as a function of albuminemia, based on the relationship obtained by Parent et al.10:
where α is the free FVPA and Alb is albumin (μmol/L).In patients with hypoalbuminemia, the free FVPA is calculated as:
where α is the free FVPA, CL is the free drug concentration and CT is the total drug concentration.In patients with normal albumin levels, for the same free drug concentration, the free FVPA is calculated with the following formula:
where αN is the free FVPA, CL the free drug concentration and CN the total drug concentration normalized by albumin serum levels.The combination of equations 2 and 3 yields a formula is obtained that allows estimating the expected total drug concentration under hypoalbuminemic conditions:
Using a model derived from a multiple linear regression, Doré et al.11 concluded that total drug concentration and albuminemia are the two variables capable of predicting free drug concentrations:
Kodama et al.12 suggested that the free FVPA could be calculated using a Scatchard binding plot that integrates the mean association constant of the drug to albumin and the mean number of binding sites to albumin:
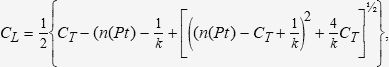
Where k is the mean association constant to albumin in the population and n(Pt) in the mean number of binding sites to albumin in the population.
Nevertheless, the estimation cannot be accurate in patients with hypoalbuminemia as it does not consider plasma albumin levels, which have a direct impact on free FVPA concentrations.
It must be said that none of the aquations above has been validated and wide variations are obtained when they are applied to populations different from those in clinical trials. Consequently, these methods cannot be used in lieu of laboratory techniques and monitoring the free FVPA is strongly recommended8–12.
The purpose of the present study is to determine the reliability of the methods used to estimate free FVPA levels in our patient population by means of a comparison between the free FVPA concentrations obtained in the laboratory and those estimated using both the previously described methods and a new method described by García et al.
MethodsA retrospective observational study was carried out at the Pharmacokinetics Unit of the Pharmacy department of the Severo Ochoa University Hospital. The data on the evaluated patients, all of them admitted between October 2017 and February 2019, were obtained from electronic medical records (Selene®), electronic prescriptions (Farhos®) and the Infinity® platform. Seventeen different free FVPA and TVPA levels were analyzed from 15 patients (8 females and 7 males), of which 11 were epileptic (73%) and 4 suffered from bipolar disorder (27%). Samples were extracted at the end of the dosing interval (trough concentrations).
Quantification of the free FVPA was carried out by an external laboratory by ultrafiltration or immunoluminiscence, which are associated with an inter and intra-assay accuracy of 6.3% and 4.6% respectively. TVPA levels were analyzed in the hospital's laboratory by an enzyme immuno-assay, with an inter- and intra-assay accuracy below 5%.
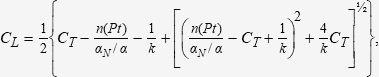
Free FVPA levels were determined with three previously published methods (Hermida9, Doré11, and Kodama12) and a method proposed by our own group (García et al), based on a modification of the method developed by Kodama12. The García method corrects the population mean value of albumin binding sites “n(Pt)” according to individual albuminaemia, multiplying this value by Hermida's αN/α ratio9:
The values estimated by thee four methods were compared with the free FVPA concentrations measured in the laboratory, and estimation errors (mean error [ME] and root-mean square error [RMSE]) were calculated to determine precision and accuracy, respectively13.
ResultsDemographic and clinical characteristics of the patients included in the study are shown in table 1. Table 2 shows the results obtained following application of the four methods mentioned above. The García et al method presented with the highest accuracy and precision levels while the Kodama method yielded the worst results. This was to be expected as the latter is only applicable to patients with albumin levels within the normal range.
Demographic and clinical characteristics of the patients in the study
| Mean ± standard deviation | Minimum - Maximum | |
|---|---|---|
| Age (years) | 74.6 ± 8.1 | 61.9-87.0 |
| Weight (Kg) | 74.7 ± 9.9 | 59.6-84.7 |
| Albumin (g/dl) | 28.8 ± 4.3 | 23.0-36.0 |
| Creatinine (mg/dl) | 0.7 ± 0.2 | 0.3-1.0 |
| Total valproic acid concentration (mg/L) | 38.6 ± 12.5 | 19.0-61.0 |
| Free fraction valproic acid concentration (mg/L) | 11.5 ± 6.9 | 5.4-31.5 |
Prediction errors resulting from the free fraction valproic acid calculation methods reviewed in this study
| Patient | Albumin (g/dL) | α (%) | tvpa (mg/L) | Free FVPA (mg/L) | Real free FVPA (mg/L) | Free FVPA (%) | Hermida11 | Doré13 | Kodama14 | Garcia | |||||||
|---|---|---|---|---|---|---|---|---|---|---|---|---|---|---|---|---|---|
| Hermida11 | Doré13 | Kodama14 | Garcia | me | rmse | me | rmse | me | rmse | me | rmse | ||||||
| 1 | 2.3 | 24.9 | 30.0 | 7.5 | 10.8 | 1.8 | 10.4 | 7.9 | 26.3 | −0.4 | 0.4 | 2.9 | 2.9 | −6.1 | 6.1 | 2.5 | 2.5 |
| 2 | 2.3 | 24.9 | 58.0 | 14.4 | 20.9 | 4.7 | 32.5 | 31.5 | 54.3 | −17.1 | 17.1 | −10.6 | 10.6 | −26.8 | 26.8 | 1.0 | 1.0 |
| 2 | 2.3 | 24.9 | 24.0 | 6.0 | 8.6 | 1.3 | 7.0 | 5.6 | 23.3 | 0.4 | 0.4 | 3.0 | 3.0 | −4.3 | 4.3 | 1.4 | 1.4 |
| 3 | 2.4 | 23.2 | 49.0 | 11.4 | 17.0 | 3.5 | 23.1 | 22.1 | 45.1 | −10.7 | 10.7 | −5.1 | 5.1 | −18.6 | 18.6 | 1.0 | 1.0 |
| 4 | 2.7 | 18.7 | 32.0 | 6.0 | 8.9 | 1.9 | 8.1 | 6.3 | 19.7 | −0.3 | 0.3 | 2.6 | 2.6 | −4.4 | 4.4 | 1.8 | 1.8 |
| 5 | 2.7 | 18.7 | 19.0 | 3.6 | 4.2 | 1.0 | 3,4 | 6.5 | 34.2 | −2.9 | 2.9 | −2.3 | 2.3 | −5.5 | 5.5 | −3,1 | 3,1 |
| 6 | 2.7 | 18.7 | 42.0 | 7.9 | 12.5 | 2.8 | 13,6 | 14.3 | 34.0 | −6.4 | 6.4 | −1.8 | 1.8 | −11.5 | 11.5 | −0.7 | 0.7 |
| 7 | 2.8 | 17.4 | 30.0 | 5.2 | 7.5 | 1.8 | 6.5 | 5.4 | 18.0 | −0.2 | 0.2 | 2.1 | 2.1 | −3,6 | 3,6 | 1.1 | 1.1 |
| 8 | 2.8 | 17.4 | 58.0 | 10.1 | 17.6 | 4.7 | 23,4 | 15.1 | 26.0 | −5.0 | 5.0 | 2.5 | 2.5 | −10.4 | 10.4 | 8.3 | 8.3 |
| 9 | 2.9 | 16.2 | 61.0 | 9.9 | 18.1 | 5.1 | 23,7 | 14.6 | 23,9 | −4.7 | 4.7 | 3,5 | 3,5 | −9.5 | 9.5 | 9.1 | 9.1 |
| 10 | 3,0 | 15.0 | 36.0 | 5.4 | 8.3 | 2.2 | 7.4 | 11.2 | 31.1 | −5.8 | 5.8 | −2.9 | 2.9 | −9.0 | 9.0 | −3,8 | 3,8 |
| 11 | 3,1 | 14.0 | 38.0 | 5.3 | 8.4 | 2.4 | 7.3 | 7.0 | 18.4 | −1.7 | 1.7 | 1.4 | 1.4 | −4.6 | 4.6 | 0.3 | 0.3 |
| 12 | 3,1 | 14.0 | 48.0 | 6.7 | 12.0 | 3,4 | 11.7 | 16.0 | 33.3 | −9.3 | 9.3 | −4.0 | 4.0 | −12.6 | 12.6 | −4.3 | 4.3 |
| 13 | 3.3 | 12.1 | 36.0 | 4.4 | 6.4 | 2.2 | 5.3 | 8.8 | 24.4 | −4.4 | 4.4 | −2.4 | 2.4 | −6.6 | 6.6 | −3.5 | 3.5 |
| 14 | 3.5 | 10.5 | 30.0 | 3.2 | 2.9 | 1.8 | 3.2 | 7.3 | 24.3 | −4.2 | 4.2 | −4.4 | 4.4 | −5.5 | 5.5 | −4.1 | 4.1 |
| 15 | 3.5 | 10.5 | 26.0 | 2.7 | 1.5 | 1.5 | 2.6 | 8.8 | 33.8 | −6.1 | 6.1 | −7.3 | 7.3 | −7.3 | 7.3 | −6.2 | 6.2 |
| 15 | 3.6 | 9.8 | 39.0 | 3.8 | 5.5 | 2.5 | 4.5 | 7.6 | 19.5 | −3.8 | 3.8 | −2.1 | 2.1 | −5.1 | 5.1 | −3.1 | 3.1 |
| Mean | 2.9 | 16.38 | 38.6 | 6.7 | 10.1 | 2.6 | 11.4 | 11.5 | 0.3 | −4.9 | 4.9 | −1.5 | 3.6 | −8.9 | 8.9 | −0.1 | 3.3 |
| Standard deviation | 4.3 | 5.1 | 12.5 | 3,2 | 5.6 | 1.2 | 8.9 | 6.9 | 0.1 | 4.4 | 4.4 | 4.1 | 2.3 | 6.0 | 6.0 | 4.2 | 2.6 |
| Minimum value | 2.3 | 9.8 | 19.0 | 2.7 | 1.5 | 1.0 | 2.6 | 5.4 | 0.2 | −17.1 | 0.2 | −10.6 | 1.4 | −26.8 | 3.6 | −6.2 | 0.3 |
| Maximum value | 3.6 | 24.9 | 61.0 | 14.4 | 20.9 | 5.1 | 32.5 | 31.5 | 0.5 | 0.4 | 17.1 | 3.5 | 10.6 | −3.6 | 26.8 | 9.1 | 9.1 |
| 95% CI | 2.7-3.1 | 14.7-19.5 | 32.6-44.5 | 5.1-8.2 | 7.4-12.7 | 2.0-3.2 | 7.2-15.6 | 8.2-14.8 | 0.2-0.3 | −7.0-2.8 | 2.8-7.0 | −3.4-0.5 | 2.5-4.7 | −11.8-6.1 | 6.1-11.8 | −2.1-1.9 | 2.0-4.5 |
a(%): free fraction of the drug; CI: confidence interval; FVPA: fraction of the valproic acid; ME: mean error; RMSE: root-mean squared error; TVPA: total valproic acid.
Therapeutic concentrations of TVPA have been set at 50-100 μg/mL. The concentrations determined in the present study are for the most part below the therapeutic interval (38.6 ± 12.5 mg/L) because of the changes occurring in the free fraction. Alpha (a) is the ratio between free fraction and TVPA concentrations, and its value varies as a function of TVPA and albumin levels. Thus, in patients with normal albumin levels, a varies between 75% and 15% for TVPA concentrations between 50 mg/L and 100 mg/L, respectively. In patients with hypoalbuminemia, the free FVPA increases because of a reduction in the number of binding sites, resulting in VPA escaping from the usual sampling site (general circulation) and diminishing TVPA concentrations. For that reason, these concentrations are not reliable enough to be used as monitoring tools, with monitoring of real free FVPA concentrations being proposed as the best alternative. The present study found increased a values (16.38 ± 12.5%) due to hypoalbuminemia. As regards the TVPA concentration interval, Wallenburg et al.14 established an Interval of 4-12 mg/L, which could indicate that 87% of the subjects in our study present potentially toxic concentrations.
Nonetheless, routine determinations of VPA do not involve monitoring free FVPA. That is why some authors have proposed the use of mathematical equations to calculate them. However, discrepancies exist across the results obtained when those methods are used, which cast doubt on their usefulness in clinical practice.
The method that differs the most from real values is the one developed by Kodama13, as the equation was obtained from individuals with normal
serum albumin levels. Thus, all free FVPA levels estimated using the Kodama equations were lower than the real values, yielding the least precise and accurate results (ME: –8.9 mg/L, RMSE: 8.9 mg/L). Hermida9 underestimated 16 of the 17 VAP concentrations (ME: –4.9 mg/L, RMSE: 4.9 mg/L). In turn, Doré’s11 method was the one shown be conform to the studied population (ME: –1.5 mg/L, RMSE: 3.6 mg/L).
Based on our findings, we propose a change to the Kodama et al. method to allow free FVPA values to be adjusted as a function of the patient's albuminemia. The results obtained from the comparison between the observed free FVPA values and those predicted by the methods under analysis show that the method developed by García et al. is the most reliable one for the studied population, providing the most accurate and precise values (ME: –0.1 mg/L, RMSE: 3.3 mg/L). Therefore, should determination of free FVPA concentrations be unfeasible, we recommend that it be estimated using the García et al. method.
The small size of our sample as well as the fact that only patients with hypoalbuminemia were analyzed constitute the chief limitations of this study. In addition, four of the 17 determinations did not correspond to steady state VPA levels, which could have altered the precision of our results.
The results obtained in this study should prompt further investigations on the subject, with larger patient cohorts, in order to confirm the usefulness of the method proposed and establish new more reliable equations to estimate free FVPA concentrations given the latter's importance in the clinical outcomes of the available treatments.
FundingNo funding.
Conflict of interestsNo conflict of interests.
Presentation at congresses65th National Congress of the Spanish Society of Hospital Pharmacists. Online. October 2020.
Early Access date (01/14/2022).

