


To determine the degree of agreement of 2 differents stratification models for pharmaceutical care to people living with HIV.
MethodsThis was a single-center observational prospective cohort study of patients with regular follow-up in pharmaceutical care consultations according to the Capacity–Motivation–Opportunity methodology, conducted between January 1 and March 31, 2023.
Patients received the pharmacotherapeutic interventions applied routinely to ambulatory care patients according to this model. As part of the usual clinical practice, the presence or absence of the variables that apply to both stratification models were collected.
The scores obtained and the corresponding stratification level were collected for each patient according to both stratification models published (ST-2017 and ST-2022).
To analyze the reliability between the measurements of 2 numerical score models of the stratification level with both tools, their degree of concordance was calculated using the intraclass correlation coefficient. Likewise, reliability was also evaluated from a qualitative perspective by means of Cohen's Kappa coefficient.
Additionally, the existence of correlation between the scores of the 2 models was assessed by calculating Pearson's correlation coefficient.
ResultsOf the total of 758 patients being followed in the cohort, finally, 233 patients were enrolled. The distribution of patients for each stratification model was: ST-2017: 59.7% level-3, 25.3% level-2, and 15.0% level-1, while for ST-2022: 60.9% level-3, 26.6% level-2, and 12.4% level-1.
It was observed that the reclassification was symmetrical (P=.317). The qualitative analysis of the agreement between the models showed a good Cohen's kappa value, (K=0.66). A value of 0.563 was found as the intraclass correlation coefficient.
Finally, the correlation analysis between the quantitative scores of the 2 models yielded a Pearson correlation coefficient of 0.86.
ConclusionsThe concordance between the 2 models was good, which confirms that the multidimensional adaptation and simplification of the model were correct and that its use can be extended in routine clinical practice.
Determinar el grado de concordancia de dos modelos diferentes de estratificación de la atención farmacéutica a personas que viven con el VIH.
MétodoSe trata de un estudio de cohortes prospectivo observacional unicéntrico de pacientes con seguimiento regular en consultas de atención farmacéutica según la metodología Capacidad-Motivación-Oportunidad, realizado entre el 1-enero y el 31-marzo de 2023.
Los pacientes recibieron las intervenciones farmacoterapéuticas aplicadas de forma rutinaria a los pacientes de atención ambulatoria según este modelo. Como parte de la práctica clínica habitual, se recogió la presencia o ausencia de las variables que se aplican a ambos modelos de estratificación.
Para cada paciente se recogieron las puntuaciones obtenidas y el nivel de estratificación correspondiente según ambos modelos de estratificación publicados (ST-2017 y ST-2022).
Para analizar la fiabilidad entre las mediciones de dos modelos de puntuación numérica del nivel de estratificación con ambas herramientas, se calculó su grado de concordancia mediante el coeficiente de correlación intraclase. Asimismo, también se evaluó la fiabilidad desde una perspectiva cualitativa mediante el coeficiente Kappa de Cohen.
Adicionalmente, se evaluó la existencia de correlación entre las puntuaciones de ambos modelos mediante el cálculo del coeficiente de correlación de Pearson.
ResultadosDel total de 758 pacientes en seguimiento de la cohorte, finalmente se incluyeron 233 pacientes. La distribución de pacientes para cada modelo de estratificación fue: ST-2017: 59,7% nivel-3, 25,3% nivel-2 y 15,0% nivel-1, mientras que para ST-2022:60,9% nivel-3, 26,6% nivel-2 y 12,4% nivel-1.
Se observó que la reclasificación era simétrica (p = 0,317). El análisis cualitativo de la concordancia entre los modelos mostró un buen valor kappa de Cohen, (K = 0,66). Se halló un valor de 0,563 como coeficiente de correlación intraclase.
Por último, el análisis de correlación entre las puntuaciones cuantitativas de los dos modelos arrojó un coeficiente de correlación de Pearson de 0,86.
ConclusionesLa concordancia entre los dos modelos fue buena, lo que confirma que la adaptación multidimensional y la simplificación del modelo fueron correctas y que su uso puede extenderse en la práctica clínica habitual.
The ageing of the HIV population and the need for a qualitative and multidimensional approach to their pharmacotherapeutic needs have led to the publication of new concepts to analyse this issue, such as stratification tools and new models of pharmaceutical care.
In this manuscript we compare the degree of concordance of the two stratification models for HIV-infected patients published to date as applied to individuals in real clinical practice. The results show that there is significant agreement between the two models, which reinforces the idea that the simplification and multidimensional adaptation has been successful, allowing their expansive use in different care settings from now on.
IntroductionHIV infection is now considered a chronic disease.1 The success of highly active antiretroviral therapy (ART) and the development of new, more potent drugs with improved dosage recommendations have enabled people living with HIV (PLWH) to significantly reduce the risk of HIV transmission and enjoy a near-normal life expectancy.2 But as people live longer, the management of PLWH, who typically have age-related comorbidities, presents a new set of concerns. Indeed, HIV cohort studies show that PLWH are disproportionately affected by conditions such as hypertriglyceridemia, hypercholesterolemia, arterial hypertension, and diabetes mellitus. As expected, the development of co-morbidities increases the use of non-antiretroviral drugs, which in turn complicates the therapeutic management of these patients.3
A multidisciplinary healthcare team is necessary for the effective management of PLWH.4 In this situation, the role of a trained HIV clinical pharmacist is crucial.5 The pharmaceutical care (PC) strategy has historically placed a strong emphasis on medicine, while ignoring the unique qualities of each patient. To provide patients with the best possible care, demographic, educational, and cognitive aspects as well as the use of medical resources should be previously assessed. To improve the self-efficacy of patients for medication management, it should also be prioritized to increase patient empowerment.
Taking into account all of the above, a redefined PC model was developed 7 years ago based on 3 differential aspects.6 First, patient stratification. It's considered that stratification of patients is an essential step in addressing them according to their specific needs, in order to optimize the use of resources and time. Second, a motivational interview with the aim of setting and defining individualized pharmacotherapy objectives. And third, performing a follow-up of the patients in real time using the new technological tools available. The Capacity–Motivation–Opportunity (CMO) PC model intervention has previously been tested in PLWH, showing successful results in improving adherence to ART, reducing cardiovascular risk, and increasing patients' activation.7–9
For the development of the first pillar of this methodology, the first stratification model was published in 2017. This tool divided patients into 3 different strata that allowed the development of interventions at various levels according to each of their needs.10 In 2022, a simplification and multidimensional adaptation of the previous published stratification model was carried out with the aim of adapting it more closely to the characteristics of the current patient and, on the other hand, to facilitate its implementation in routine practice.11
For this reason, there is currently no data in real clinical practise on the concordance between the 2 stratification models.
The main objective of this study was to determine the degree of agreement between both stratification models. As secondary objectives, we analyze the reliability qualitatively and, additionally, study the existence of a correlation between the scores of the models in order to stablish, where appropriate, a translation between the two models.
MethodsThis was a single-center observational prospective cohort study of PLWH with regular follow-up in PC consultations according to the CMO methodology, conducted between January 1 and March 31, 2023. This study was approved by the Research Ethics Committee of the hospital where the research was conducted.
PatientsParticipants were included in the study if they met the following criteria: patients with HIV infection ≥18 years of age, receiving active ART for at least 2 years prior to their inclusion in the study. Patients were excluded if they were participating in a clinical trial or did not give their written informed consent. Therefore, only those patients who attended the pharmacy office in person were included in the study.
InterventionsPatients received the pharmacotherapeutic interventions applied routinely to ambulatory care patients according to CMO PC model.8 Firstly, an initial stratification of the patients in 3 levels according to the risk-stratified model for pharmaceutical care in PLWH of the Spanish Society of Hospital Pharmacy, both the 2017 and 2022 was done. Each patient received intensive PC corresponding to predetermined interventions for each level of care. During face-to-face visit to the Hospital Pharmacy Service, a motivational interview was performed for each patient. In each interview, pharmacotherapeutic objectives were established or re-evaluated, in consensus with the rest of the medical team responsible for the patient's care at all times.
Lastly, patients had access to a website (www.farmaciavalmecpv.com), developed by Valme's Hospital pharmacy department, containing information about adherence and healthy living habits. The website included videos, infographics, diptychs, links to other websites, articles, and other relevant information on this matter. This tool was available and updated throughout the follow-up, so that patients could access uploaded content at any time according to their digital skills. All patients received permanent contact tools (telephone, email, etc.) with the study pharmacists to resolve any incident or doubt related to their treatment at any time during the study.
OutcomesThe scores obtained and the corresponding stratification level were collected for each patient with both stratification models.
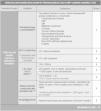
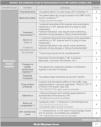
For this purpose, there was a website tools with the Stratification Tool-2017 (ST-2017)10 and Stratification Tool-2022 (ST-2022).11 Both Stratification Tool variables are described in Appendix 1.
As part of the usual clinical practice, the presence or absence of the variables that apply to both stratification models were collected.
Sample sizeTo estimate the intraclass correlation coefficient as a measure of agreement of the 2 study models, quantitative measurement instruments for patient complexity and individualized follow-up needs in both models, assuming an expected value of 0.90, a confidence level of 95%, and a precision or width of the interval of 5%, a minimum of 228 assessments were necessary. The calculation was determined from Bonett's formulas using an Excel spreadsheet.12
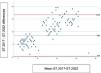
Statistical analysisTo analyze the reliability between the measurements of 2 numerical score models of the stratification level with both tools: ST-2017 and ST-2022, their degree of concordance was calculated using the intraclass correlation coefficient and complemented by a Bland–Altman plot, which in addition to concordance shows any systematic trends and possible outliers. It allows identifying dispersion patterns and evaluating whether the variability of the difference's changes depending on the level of the measurements. If good agreement is observed between the methods, most of the differences will be within the limits of agreement and the mean line will be close to zero.
McNemar–Bowker Test was used to analyze the differences between the stratification levels and their direction. This tool allows analyzing the association or discordance between 2 categorical variables with more than 2 categories, providing a robust way to evaluate statistical significance in studies where the independence between the variables is not met.
Likewise, reliability was also evaluated from a qualitative perspective by means of Cohen's Kappa coefficient, which indicates the degree of agreement between the classification levels of the 2 models.
Additionally, the existence of correlation between the scores of the 2 models was assessed by calculating Pearson's correlation coefficient and, if this was high, a simple linear regression model was performed to express the average linear translation between these scores.
The analysis was performed with the IBM SPSS v. 28.0 statistical software.
ResultsOf the total of 758 patients being followed in the cohort, finally, 233 patients were enrolled. Patients' baseline characteristics are summarized in Table 1.
Patient baseline characteristics.
| Characteristics | Total cohort (N=233) |
|---|---|
| Demographic | |
| Mean age, years (SD) | 53 (7.0) |
| Male gender, N (%) | 175 (75.1) |
| HIV | |
| HIV acquisition, N (%) | |
| Sexual | 138 (59.0) |
| Parenteral | 95 (41.0) |
| Undetectable viral load, N (%) | 217 (93.0) |
| CD4 count >300 cells/u, N (%) | 207 (89.3) |
| CD4/CD8 ratio <1, N (%) | 108 (46.0) |
| Morbidity pattern | |
| Metabolic/Cardiac | 133 (57.0) |
| Thyroid/mechanic | 4 (1.8) |
| Psycho/geriatric | 96 (41.2) |
| Pharmacotherapy | |
| Single tablet regimen | |
| Yes | 189 (81.1) |
| No | 44 (19.9) |
| ART adherence | |
| >90% | 222 (95.2) |
| <90% | 11 (4.7) |
| Concomitant treatment | |
| Yes | 209 (89.6) |
| No | 24 (11.4) |
| Polypharmacy (>6) | 109 (46.7) |
| Major polypharmacy (>11) | 42 (18.0) |
| Polypharmacy pattern | |
| Depression/Anxiety | 106 (45.4) |
| COPD | 13 (5.5) |
| CVD | 109 (46.7) |
| Mixed | 8 (3.4) |
| Prescribed concomitant medicationsa | |
| Lipid-lowering drugs | 91 (39.0) |
| Psychotropic drugs | 87 (37.0) |
| Antihypertension medications | 84 (36.0) |
| Drugs for musculoskeletal pain | 65 (28.0) |
| Drugs for gastric acid-related disorders | 58 (25.0) |
| Drugs for chronic respiratory disease | 58 (25.0) |
COPD, chronic obstructive pulmonary disease; CVD, cardiovascular disease. SD, standard deviation.
The most common ART regimens were those including a combination of 2 nucleoside reverse transcriptase inhibitors (NRTIs) plus an integrase inhibitor (42.6%), followed by 2 NRTIs plus a non-nucleoside reverse transcriptase inhibitor (16.4%), and 2 NRTIs plus a protease inhibitor (11.5%). Other combined therapies represented the 29.5% of the patients' regimens. Regarding prescribed concomitant medications, lipid-lowering drugs were the most frequently used followed by psychotropic drugs (39% and 37% of patients respectively). The median number of prescribed concomitant drugs per patient was 7 (IQR: 5–8).
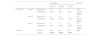
The distribution of patients for each stratification model was as follows. For ST-2017: 59.7% level 3, 25.3% level 2, and 15.0% level 1, while for ST-2022—they were distributed as 60.9% level 3, 26.6% level 2, and 12.4% level 1 (Table 2).
Analysis of the differences between the stratification levels and their direction.
| Tool-2022 | Overall | |||||
|---|---|---|---|---|---|---|
| Level 3 | Level 2 | Level 1 | ||||
| Tool-2017 | Level 3 | Recount (n) | 127 | 12 | 0 | 139 |
| % Matching | 91.4% | 8.6% | 0.0% | 100.0% | ||
| 59.7% | ||||||
| Level 2 | Recount (n) | 12 | 40 | 7 | 59 | |
| % Matching | 20.3% | 67.8% | 11.9% | 100.0% | ||
| 25.3% | ||||||
| Level 1 | Recount (n) | 3 | 10 | 22 | 35 | |
| % Matching | 8.6% | 28.6% | 62.9% | 100.0% | ||
| 15.0% | ||||||
| Overalla | Recount | 142 | 62 | 29 | 233 | |
| Overall | 60.9% | 26.6% | 12.4% | |||
Matching = Patients classified in the same stratum by the 2 tools.
The average score obtained after ST-2017 application was 13.4 and ST-2022 was 6.5.
Table 2 shows, on the one hand, the reclassification of the complexity that ST-2022 performs for each level of stratification according to ST-2017 and, on the other, the qualitative concordance of the 3 levels of stratification between the 2 models. It was observed that the reclassification is symmetrical because the changes from one degree to another in the stratification classified by the 2 models occur in both directions with the same probability (P=.317). The qualitative analysis of the agreement between the models showed a good Cohen's kappa value, K=0.66, with the low level of complexity for ST-2017 being the most consistent for ST-2022 (91.4%), followed by the intermediate level (67.8%), and the hight level (63.0%).
Quantitative analysis of the agreement between models showed a Cohen's kappa value (K=0.66).
When the agreement between the models was analyzed from the quantitative perspective, a value of 0.563 was found as the intraclass correlation coefficient, expressing moderate agreement in the classification of complexity levels (Fig. 1).

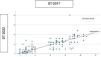
Finally, the correlation analysis between the quantitative scores of the 2 models yielded a Pearson correlation coefficient of 0.86, which indicated the existence of a linear translation between the models. After performing a simple linear regression analysis, the result was the equation Score (ST-2022)=0.84+0.42 * Score (ST-2017), such that ST-2022 explained 75% of the variability of ST-2017 (Fig. 2).
Discussion
Our single-center study demonstrates that the agreement between both stratification models of PWLH patients is good.
Our findings indicated that the new stratification model robustly identifies different populations at risk for adverse health outcomes, highlighting the potential benefits of using this care strategy to optimize the timing and feasibility of PC interventions.
The concordance between the overall risk scores obtained from both stratification tools was high. This may be explained by the fact that these calculators use predictor variables for risk scores and generate analogous classifications for the same risk scores for the same patients. It should be noted that ST-2017 consisted of 4 dimensions with 21 variables, while ST-2022 includes 9 dimensions and 17 variables. Aspects such as level of education, patient–professional relationship, HCV coinfection, changes in regimen, or level of satisfaction with ART have been excluded from that first model. These variables are no longer related with the current context of management of PLWH, neither from the perspective of the patient profile nor from the characteristics of the prescribed treatments. Therefore, eliminating these variables, extending them to others related to cognitive impairment, frailty, or adherence to pharmacotherapeutic targets, a more comprehensive understanding of patients' true needs can be achieved. This, in turn, allows for the implementation of appropriate interventions to enhance patients' quality of life.
Demographic and epidemiological changes are leading to an increase in the number of patients with multiple chronic diseases, and it is well known that these multipathological patients, among whom PLWH are increasingly found, consume a significant portion of healthcare resources.13,14 However, not all have the same risk of decompensation, and therefore being able to identify patients at the highest risk helps adapt resources to needs, as recommended by new models of chronic care such as the Chronic Care Model or Kaiser Permanente.15–17
Risk classification systems are not an end in themselves, but a means of identifying patients to whom special effort must be dedicated with greater and different resources; therefore, before deciding on one or another stratification system, it is necessary to know its validity.
With the results obtained, according to the percentage distribution in each model, we can even affirm that the “ST-2022” is more in line with the theoretical distribution marked for this type of models of 60–30–10%. This distribution better guarantees that its use allows the purpose for which it has been designed, which is none other than to use it to carry out the interventions best suited to the needs of each patient, optimizing the time in PC consultations.
Internationally, different stratification tools are being used in different settings and populations, such as emergency departments, chronic care services, etc. These tools have numerous benefits for healthcare, with a common goal of promoting a holistic approach to patient assessment and guiding professional actions. They play an essential role in clinical decision-making and choosing the most appropriate approach to patient treatment. Guide decisions on the disposition of people cared for in terms of medical services, referral to highly complex services and the design of services by measuring the nature and magnitude of risk and mapping care pathways for patients.13–16
This study presents some potential limitations. First, the unicenter nature of the study. However, the initial multicenter design of the stratification models allows us to extrapolate both the percentage distribution of the population and the scores established in a single center, since their representation has been contrasted. Furthermore, another possible limitation of this study was that only patients who attended the consultation in person were included. However, this does not mean that this was considered a more demanding population or that patients with greater disability requiring additional resources were excluded. This is because in the usual workflow, the single act of care is strengthened in coordination with other medical visits or hospital functional tests, at which the patient must also participate. Therefore, the study reflects the usual clinical practice.
The utility of the ST-2017 stratification model to predict the risk of death in 1 year among PWLH has recently been determined. It remains to be determined whether the new model further refines the risk, given the variables included in its development.17
To promote the use of these stratification systems, it is necessary to integrate and automate them in the information systems of the different health systems, allowing real-time decision-making for these patients, as recommended by the applicable quality guidelines in the field.18 However, it is necessary to consider the integration of advanced technologies such as machine learning or even artificial intelligence. In this way, more sophisticated algorithms could be developed that use clinical data and biomarkers to predict the evolution of a patient and the most efficient interventions adjusted to each case.
Future research lines will allow us to learn about and evaluate long-term clinical outcomes, quality of life, and costs associated with the stratification of PC. Such research could provide a more complete understanding of the long-term benefits and challenges of these models and help guide clinical and policy decision-making. Moreover, expanding the use of the ST-2022 in different care settings will allow us to identify, in part, that the simplification undertaken has been useful and has contributed to the generalization of routine use.
Finally, more studies are also needed to validate their effectiveness and assess their applicability in different healthcare settings around the world. This would help to strengthen the scientific basis of these models and improve their widespread practical implementation.
In conclusion, the concordance between the 2 patient stratification models was good, confirming that the multidimensional adaptation and simplification of the initial model was correct and that the use of the simplified model can be extended in routine clinical practice, to allow interventions to be tailored to the real needs of each patient.
Statement of authorshipAll authors contributed to the development of the original idea and study design. Ramón Morillo-Verdugo drafted the manuscript, which was subsequently reviewed and approved for publication by all the authors.
FundingNone declared.
Ethical responsibilitiesThe study was approved by the Research Ethics Committee of Sur de Sevilla (Seville, Spain). All participants received information about the study and its objectives, and signed the informed consent forms provided to them.
Conflict of interestThe authors declare that they have no conflicts of interest.
CRediT authorship contribution statementRamón Morillo-Verdugo: Writing – original draft, Project administration, Methodology, Formal analysis, Data curation, Conceptualization. Sebastián Parra-Zuñiga: Writing – review & editing, Methodology, Investigation, Formal analysis, Data curation. María Alvarez de Sotomayor-Paz: Writing – review & editing, Validation, Methodology, Conceptualization. Enrique Contreras-Macias: Writing – review & editing, Validation, Methodology, Conceptualization. Carmen Victoria Almeida-González: Writing – review & editing, Methodology, Formal analysis, Data curation. Maria de las Aguas Robustillo-Cortés: Writing – review & editing, Validation, Methodology, Conceptualization.


