


To validate the IF-CSS frailty index according to its predictive capacity for mortality and to define the intervals compatible with frailty states.
MethodsAn observational, retrospective, multicenter study of a cohort of elderly patients from four nursing homes with a follow up between 12 and 38 months was conducted. The IF-CSS comprised 17 variables across four domains from the comprehensive geriatric assessment. Contrast of hypothesis log-rank for survival curves according to IF-CSS index was performed. The predictive model of survival time was performed using a parametric accelerated failure model.
Results535 patients with a mean age of 83.62 years (SD7.84) were included. Mortality rate during the study period was 39.8%. Survival curves by frailty intervals showed significant differences (χ2 = 92; p < 0.001). The comparative analysis also showed significant differences for almost all the variables included in the construct. The parametric model of accelerated failure estimated a 29% reduction in survival time for each tenth of an increase in the IF-CSS.
ConclusionsThe IF-CSS results in a tool with a frailty discriminative and mortality predictive capacity that allows its use in the care programs of nursing homes.
validar el índice de fragilidad IF-CSS de acuerdo con su capacidad predictiva de mortalidad y definir los intervalos compatibles con los estados de fragilidad.
Métodoseste es un estudio observacional, retrospectivo y multicéntrico de una cohorte de pacientes institucionalizados en 4 residencias para personas mayores, dependientes y con un seguimiento entre 12 y 38 meses. El IF-CSS consta de 17 variables incluidas en la valoración geriátrica integral. El contraste de las estimaciones de las curvas de supervivencia se ha realizado mediante el test log-rank. El modelo predictivo del tiempo de supervivencia se ha realizado mediante un modelo paramétrico de fallo acelerado.
Resultadosse incluyeron 535 pacientes de una edad media de 83,62 años (DE7,84). La mortalidad durante el periodo de estudio fue del 39,8%. Las curvas de supervivencia por intervalos de fragilidad mostraron diferencias significativas (χ2 = 92; p < 0,001). El análisis comparativo entre los pacientes vivos y los fallecidos también mostró diferencias significativas para la mayoría de las variables incluidas en el constructo. El modelo paramétrico de fallo acelerado estimó una reducción del 29% del tiempo de supervivencia por cada décima de aumento del IF-CSS.
Conclusionesel IF-CSS presenta un grado de predicción de mortalidad y de capacidad discriminativa de fragilidad, que permite su uso en la dinámica asistencial de los centros sociosanitarios.
A high proportion of nursin home (NH) residents are frail and have complex medical histories, multiple comorbidities and high levels of functional dependency.1 In this type of centers, a multidisciplinary team provides basic and personal care assistance. However, these teams rely to different extents on external healthcare support to control symptoms of disease progression, deliver end-of-life care and manage the consequences of frailty, including falls, delirium or disease exacerbations.2
Comprehensive geriatric assessment (CGA) is the most effective tool for evaluating needs in older adults.3 The presence of multiple concurrent physiopathological and psychopathological problems requires a multidimensional approach to ensure patient-centered care.3 However, adopting this approach is challenging, as it requires every dimension (clinical, functional, cognitive and social) to be evaluated by a multidisciplinary team. Additionally, this process yields qualitative information that is difficult to interpret and apply for population stratification.4 Moreover, residents' status varies over time as a result of disease progression, disability or development of geriatric syndromes. In this respect, incorporating a tool for the quantitative measurement of frailty as a continuous variable emerges as a more effective approach to the management of this population.5
Frailty is a multidimensional clinical entity defined as the age-related progressive deterioration of physiological systems, causing a reduction of intrinsic capacity reserves, thereby conferring higher vulnerability to stressors and increasing the risk for adverse clinical outcomes.6,7 Frailty is also a powerful predictor of negative outcomes, including the need for hospital admission, disability and death.8
Indices based on the deficit accumulation model9 measure frailty as a continuous variable, thereby enabling the assessment of frailty trajectory over a patient's lifetime. In recent years a variety of frailty indices have emerged, adapted to different healthcare settings4,10,11 and clinical specialties,12,13 or developed from data extracted from electronic health record systems.14,15
Despite their potential, frailty indices are not used in ordinary clinical practice. Nursing homes (NHs) are not an exception, and very few indices have been developed for application in this setting.15 The IF-CSS frailty index was developed in a preliminary study conducted in 2018. This index was designed using the variables of the CGA performed in nursing homes in our environment, showing a good power of discrimination.16
The objectives of this study include validating IF-CSS performance in predicting mortality, along with defining frailty status intervals (non-fragile, mild, moderate and advanced frailty).
Materials and methodsStudy design, context and participantsAn observational, retrospective, multicentric study was conducted in four NHs in the Valencian Community, Spain. The study was approved by the Ethics Committee of Hospital of Sagunto (FEF-ICF-2021-01).
The recruitment period extended from January 1, 2017, to February 28, 2019. The follow-up period had to be interrupted in February 2020 to ensure that the SARS-COV-2 pandemic did not influence the risk of mortality of the study population. The inclusion criteria were as follows:
- •
Users of the NHs Burriana, La Cañada, Puerto de Sagunto and Torrente.
- •
Age ≥ 65 years.
- •
Availability of a CGA including the variables considered in the IF-CSS between January 1, 2017, and February 28, 2019, to ensure a minimum follow-up period of 12 months.
The only exclusion criterion was a terminal status, defined as being in the last days of life under palliative care.
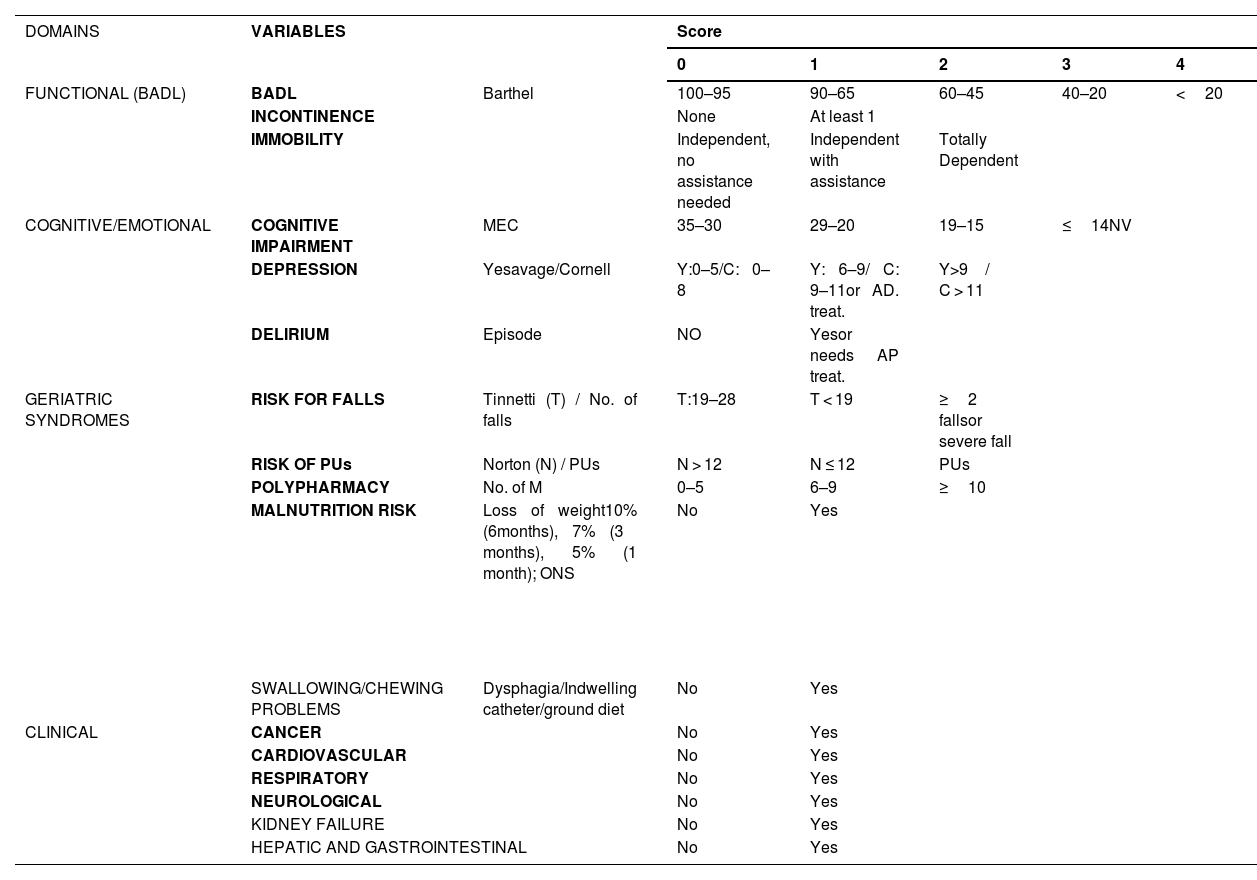
IF-CSS designIF-CSS was organized into four dimensions (functional, mental, geriatric syndromes, and clinical), including 17 variables encompassing a total of 27 deficits (Table 1). This index is calculated by dividing accumulated patient deficits by the total possible deficits, yielding a result of 0 (no deficits) to 1 (presence of all deficits). Variables were selected according to consensus criteria, namely: association with age and health problems; representation of different domains, resistance to early saturation, and exclusion of highly prevalent or very infrequent items.17 An essential requirement was the inclusion of variables in the CGA of NHs in our environment. Pre-defined frailty intervals included: non-frail (≤0.2); mild (>0.2 ≤0.35); moderate (>0.35 ≤0.55) and advanced (>0.55) frailty.16
Description of the IF-CSS frailty index.
| DOMAINS | VARIABLES | Score | |||||
|---|---|---|---|---|---|---|---|
| 0 | 1 | 2 | 3 | 4 | |||
| FUNCTIONAL (BADL) | BADL | Barthel | 100–95 | 90–65 | 60–45 | 40–20 | <20 |
| INCONTINENCE | None | At least 1 | |||||
| IMMOBILITY | Independent, no assistance needed | Independent with assistance | Totally Dependent | ||||
| COGNITIVE/EMOTIONAL | COGNITIVE IMPAIRMENT | MEC | 35–30 | 29–20 | 19–15 | ≤14NV | |
| DEPRESSION | Yesavage/Cornell | Y:0–5/C: 0–8 | Y: 6–9/ C: 9–11or AD. treat. | Y > 9 / C > 11 | |||
| DELIRIUM | Episode | NO | Yesor needs AP treat. | ||||
| GERIATRIC SYNDROMES | RISK FOR FALLS | Tinnetti (T) / No. of falls | T:19–28 | T < 19 | ≥2 fallsor severe fall | ||
| RISK OF PUs | Norton (N) / PUs | N > 12 | N ≤ 12 | PUs | |||
| POLYPHARMACY | No. of M | 0–5 | 6–9 | ≥10 | |||
| MALNUTRITION RISK | Loss of weight10% (6 months), 7% (3 months), 5% (1 month); ONS | No | Yes | ||||
| SWALLOWING/CHEWING PROBLEMS | Dysphagia/Indwelling catheter/ground diet | No | Yes | ||||
| CLINICAL | CANCER | No | Yes | ||||
| CARDIOVASCULAR | No | Yes | |||||
| RESPIRATORY | No | Yes | |||||
| NEUROLOGICAL | No | Yes | |||||
| KIDNEY FAILURE | No | Yes | |||||
| HEPATIC AND GASTROINTESTINAL | No | Yes | |||||
BADL: basic activities of daily living; C: Cornell scale for depression in dementia; MEC: mini-mental state examination for the Spanish population; No.M: number of medications; ONS: oral nutritional supplementation; AD Treat: antidepressant treatment;. AP treat.: antipsychotic treatment; PU: pressure ulcer; Y: Yesavage geriatric depression scale.
Each variable was scored so that the weight of each domain corresponded to that of previously validated indices.17–19 Binary variables were scored as a function of the presence or absence of the deficit. Quantitative variables derived from scales were categorized using cut-off intervals established and accepted in clinical practice (Table 1).
Study variables, data sources and biasEach NH resident underwent a CGA every six months in accordance with a schedule designed by the multidisciplinary care team. All variables were collected at the time of CGA. This study was based on data from the first CGA performed during the study period. The IF-CSS was calculated by the pharmacist of the NH team. Subsequently, the dates of death up to February 28, 2020, were collected through a review of residents' medical histories.
The majority of variables were dichotomous and well-defined. The scales had been validated and were used by professionals experienced in their use. The criteria for scoring the variables associated with the clinical dimension are detailed in Annex I.
Sample size and statistical methodsStatistical analysis was performed by Biostatech, Advice, Training & Innovation in Biostatistics S.L.
Considering the frailty reported in previous studies,4 a sample size of 530 patients was established, assuming a 95% confidence interval and a margin of error of 3%.
Descriptive analysis included absolute and relative frequencies for categorical variables and means and standard deviations for qualitative variables. Comparative analysis of survivors and non-survivors was carried out using Fisher's exact test for categorical variables, and chi-squared test, as appropriate for the number of patients in each category. Quantitative variables were analyzed with Welch's test and one-way ANOVA when assumptions of normality and equal variances were met; otherwise, the Mann–Whitney or Kruskal-Wallis tests were employed, according to the number of groups being compared.
The analysis of survival was carried out using the first IF-CSS value obtained for each patient during the follow-up period using Kaplan–Meier (KM) curves. Estimations for the predefined frailty intervals were performed using the log-rank test. In addition, statistical criteria were used to assess other potential categorization models that could better define frailty levels (Annex II). This analysis was also conducted for all the variables included in the construct for sex and NH where patients resided.
Given that the proportional hazards assumption for the IF-CSS variable was not met, survival time was estimated using a parametric accelerated failure time model instead of a Cox regression. An analysis of ROC curves was conducted to evaluate the prognostic performance of IF-CSS at 1 and 2 years.
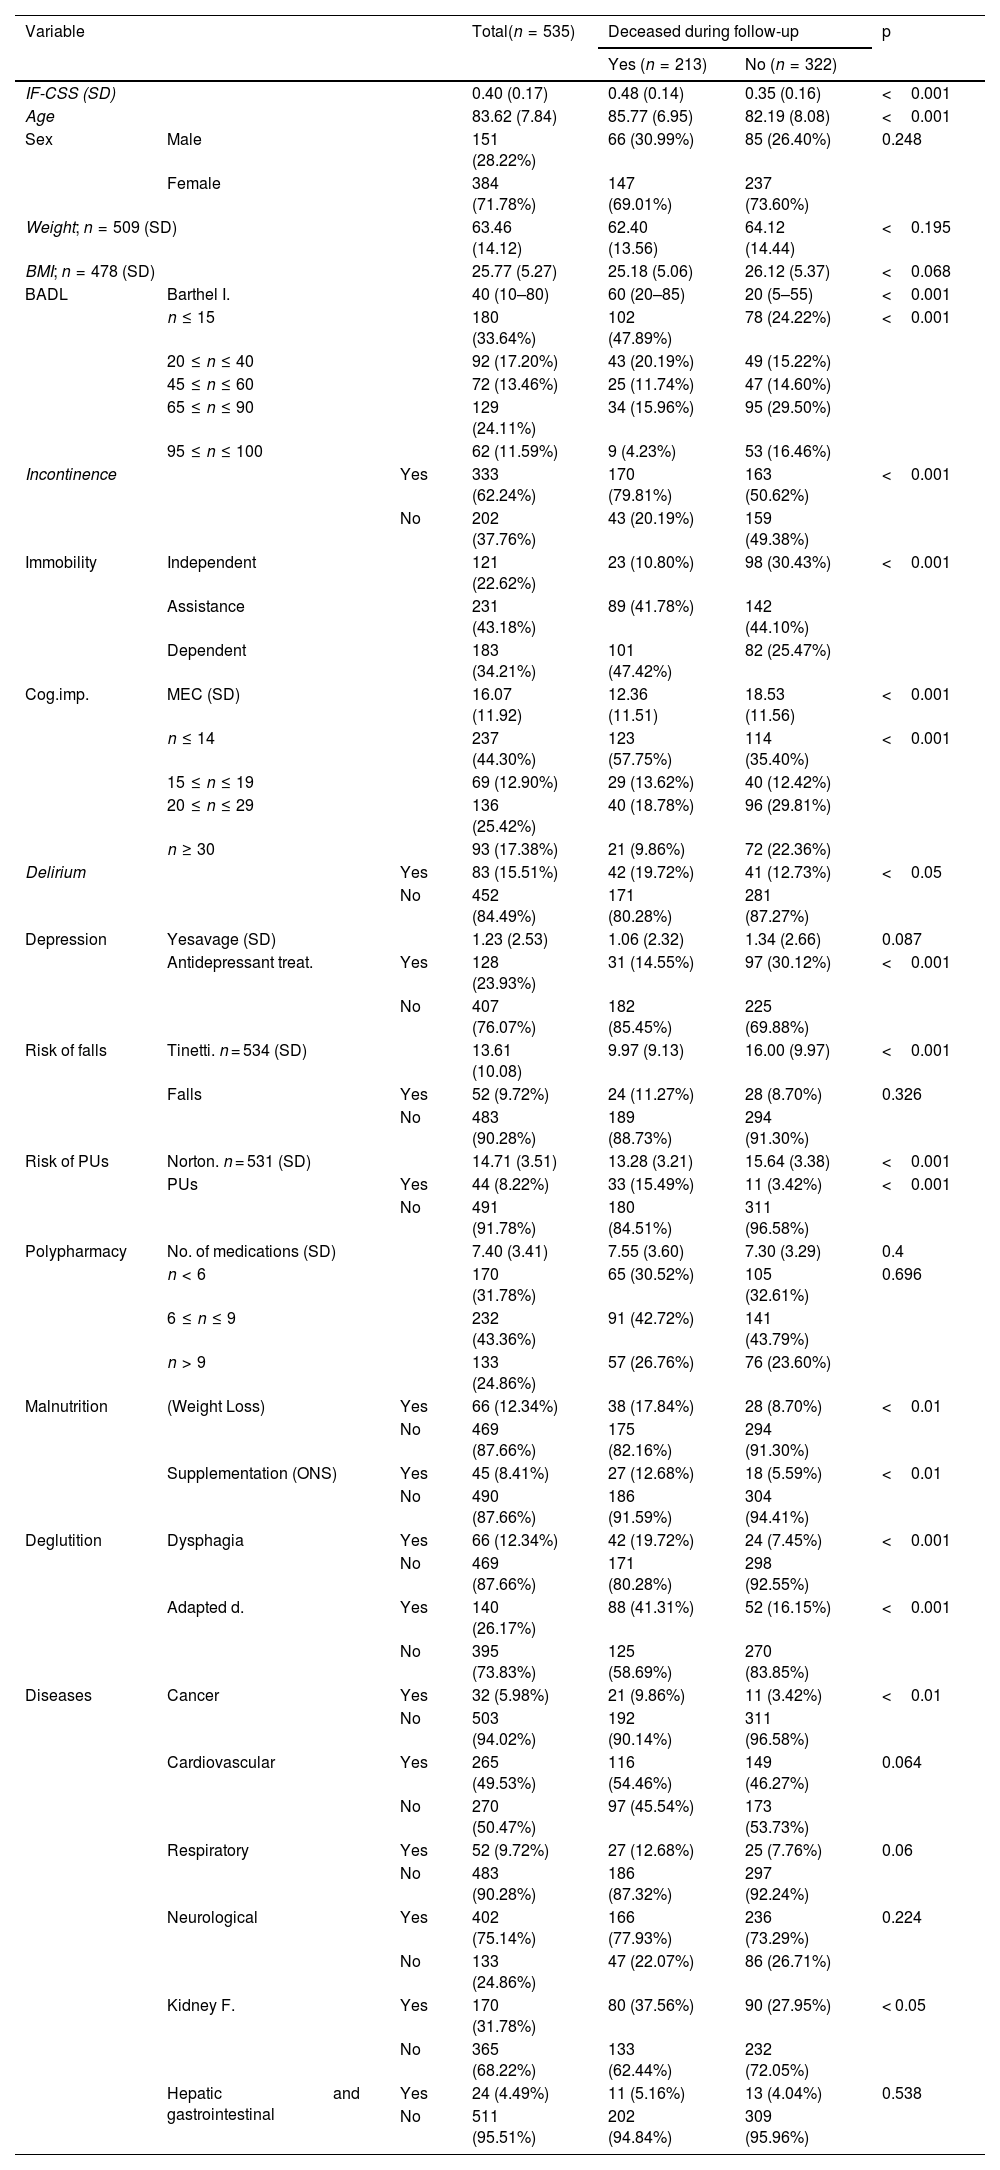
ResultsParticipants and descriptive dataA total of 535 patients were included, with a mean age of 83.62 years (SD 7.84), with 71.8% being women. The mean follow-up time was 1.99 years (SD 0.87). The population exhibited a high level of functional dependency, as shown by the median of the Barthel index (40; IQR 10–80) and the fact that 64.3% of patients had a moderate–severe functional dependency. Additionally, the mean MEC value was 16.07 (SD 11.92), with 57.2% presenting with a moderate-advanced cognitive impairment, whereas only 17.4% had no cognitive impairment. Regarding geriatric syndromes, 62.2% suffered from incontinence; 34.2% had immobility; and 33.1% were affected or at a high risk of developing pressure ulcers (PUs). In relation to diseases, a high proportion of participants had a neurological disease (75.1%), primarily dementia. Descriptive results for the study variables are detailed in Table 2, along with the number of the cases included for variables with incomplete data.
Results for the variables and survivor - non-survivor comparison during follow-up⁎.
| Variable | Total(n = 535) | Deceased during follow-up | p | |||
|---|---|---|---|---|---|---|
| Yes (n = 213) | No (n = 322) | |||||
| IF-CSS (SD) | 0.40 (0.17) | 0.48 (0.14) | 0.35 (0.16) | <0.001 | ||
| Age | 83.62 (7.84) | 85.77 (6.95) | 82.19 (8.08) | <0.001 | ||
| Sex | Male | 151 (28.22%) | 66 (30.99%) | 85 (26.40%) | 0.248 | |
| Female | 384 (71.78%) | 147 (69.01%) | 237 (73.60%) | |||
| Weight; n = 509 (SD) | 63.46 (14.12) | 62.40 (13.56) | 64.12 (14.44) | <0.195 | ||
| BMI; n = 478 (SD) | 25.77 (5.27) | 25.18 (5.06) | 26.12 (5.37) | <0.068 | ||
| BADL | Barthel I. | 40 (10–80) | 60 (20–85) | 20 (5–55) | <0.001 | |
| n ≤ 15 | 180 (33.64%) | 102 (47.89%) | 78 (24.22%) | <0.001 | ||
| 20 ≤ n ≤ 40 | 92 (17.20%) | 43 (20.19%) | 49 (15.22%) | |||
| 45 ≤ n ≤ 60 | 72 (13.46%) | 25 (11.74%) | 47 (14.60%) | |||
| 65 ≤ n ≤ 90 | 129 (24.11%) | 34 (15.96%) | 95 (29.50%) | |||
| 95 ≤ n ≤ 100 | 62 (11.59%) | 9 (4.23%) | 53 (16.46%) | |||
| Incontinence | Yes | 333 (62.24%) | 170 (79.81%) | 163 (50.62%) | <0.001 | |
| No | 202 (37.76%) | 43 (20.19%) | 159 (49.38%) | |||
| Immobility | Independent | 121 (22.62%) | 23 (10.80%) | 98 (30.43%) | <0.001 | |
| Assistance | 231 (43.18%) | 89 (41.78%) | 142 (44.10%) | |||
| Dependent | 183 (34.21%) | 101 (47.42%) | 82 (25.47%) | |||
| Cog.imp. | MEC (SD) | 16.07 (11.92) | 12.36 (11.51) | 18.53 (11.56) | <0.001 | |
| n ≤ 14 | 237 (44.30%) | 123 (57.75%) | 114 (35.40%) | <0.001 | ||
| 15 ≤ n ≤ 19 | 69 (12.90%) | 29 (13.62%) | 40 (12.42%) | |||
| 20 ≤ n ≤ 29 | 136 (25.42%) | 40 (18.78%) | 96 (29.81%) | |||
| n ≥ 30 | 93 (17.38%) | 21 (9.86%) | 72 (22.36%) | |||
| Delirium | Yes | 83 (15.51%) | 42 (19.72%) | 41 (12.73%) | <0.05 | |
| No | 452 (84.49%) | 171 (80.28%) | 281 (87.27%) | |||
| Depression | Yesavage (SD) | 1.23 (2.53) | 1.06 (2.32) | 1.34 (2.66) | 0.087 | |
| Antidepressant treat. | Yes | 128 (23.93%) | 31 (14.55%) | 97 (30.12%) | <0.001 | |
| No | 407 (76.07%) | 182 (85.45%) | 225 (69.88%) | |||
| Risk of falls | Tinetti. n = 534 (SD) | 13.61 (10.08) | 9.97 (9.13) | 16.00 (9.97) | <0.001 | |
| Falls | Yes | 52 (9.72%) | 24 (11.27%) | 28 (8.70%) | 0.326 | |
| No | 483 (90.28%) | 189 (88.73%) | 294 (91.30%) | |||
| Risk of PUs | Norton. n = 531 (SD) | 14.71 (3.51) | 13.28 (3.21) | 15.64 (3.38) | <0.001 | |
| PUs | Yes | 44 (8.22%) | 33 (15.49%) | 11 (3.42%) | <0.001 | |
| No | 491 (91.78%) | 180 (84.51%) | 311 (96.58%) | |||
| Polypharmacy | No. of medications (SD) | 7.40 (3.41) | 7.55 (3.60) | 7.30 (3.29) | 0.4 | |
| n < 6 | 170 (31.78%) | 65 (30.52%) | 105 (32.61%) | 0.696 | ||
| 6 ≤ n ≤ 9 | 232 (43.36%) | 91 (42.72%) | 141 (43.79%) | |||
| n > 9 | 133 (24.86%) | 57 (26.76%) | 76 (23.60%) | |||
| Malnutrition | (Weight Loss) | Yes | 66 (12.34%) | 38 (17.84%) | 28 (8.70%) | <0.01 |
| No | 469 (87.66%) | 175 (82.16%) | 294 (91.30%) | |||
| Supplementation (ONS) | Yes | 45 (8.41%) | 27 (12.68%) | 18 (5.59%) | <0.01 | |
| No | 490 (87.66%) | 186 (91.59%) | 304 (94.41%) | |||
| Deglutition | Dysphagia | Yes | 66 (12.34%) | 42 (19.72%) | 24 (7.45%) | <0.001 |
| No | 469 (87.66%) | 171 (80.28%) | 298 (92.55%) | |||
| Adapted d. | Yes | 140 (26.17%) | 88 (41.31%) | 52 (16.15%) | <0.001 | |
| No | 395 (73.83%) | 125 (58.69%) | 270 (83.85%) | |||
| Diseases | Cancer | Yes | 32 (5.98%) | 21 (9.86%) | 11 (3.42%) | <0.01 |
| No | 503 (94.02%) | 192 (90.14%) | 311 (96.58%) | |||
| Cardiovascular | Yes | 265 (49.53%) | 116 (54.46%) | 149 (46.27%) | 0.064 | |
| No | 270 (50.47%) | 97 (45.54%) | 173 (53.73%) | |||
| Respiratory | Yes | 52 (9.72%) | 27 (12.68%) | 25 (7.76%) | 0.06 | |
| No | 483 (90.28%) | 186 (87.32%) | 297 (92.24%) | |||
| Neurological | Yes | 402 (75.14%) | 166 (77.93%) | 236 (73.29%) | 0.224 | |
| No | 133 (24.86%) | 47 (22.07%) | 86 (26.71%) | |||
| Kidney F. | Yes | 170 (31.78%) | 80 (37.56%) | 90 (27.95%) | < 0.05 | |
| No | 365 (68.22%) | 133 (62.44%) | 232 (72.05%) | |||
| Hepatic and gastrointestinal | Yes | 24 (4.49%) | 11 (5.16%) | 13 (4.04%) | 0.538 | |
| No | 511 (95.51%) | 202 (94.84%) | 309 (95.96%) | |||
BADL:basic activities of daily living; Adapted d.: adapted diet; Cog.imp: cognitive impairment; BMI: body mass index; MEC: mini-mental state examination for the Spanish population; PU: pressure ulcer. ONS: oral nutritional supplementation.
As many as 85.2% (n = 456) of patients presented some level of frailty, which was mild in 25.8% (n = 138); moderate in 34.4% (n = 184) and advanced in 25.0% (n = 134). Complete data were available for all variables in over 95% of cases, and were neither excessively prevalent (>80%) nor very infrequent (<1%). The construct remains below the submaximal limit of 0.7 in 98.7% of cases, with IF-CSS values showing a right-skewed distribution (Fig. 1).
Analysis of survival
The longest follow-up period was 38 months. During this period, a total of 213 deaths (39.8%) were recorded. No patients were lost to follow-up. The Kaplan–Meier estimation for the study cohort is shown in Fig. 2. The accumulated probability of survival over time was 0.541 (95%CI: 0.493–0.594).

Significant differences were observed in the survival curves estimated for each frailty group (test log-rank: χ2 = 92, p < 0.001) for the predefined frailty intervals (Fig. 3A) and other groups based on statistical criteria (Fig. 3B and C).
. A) Level groups were established based on clinical criteria. B and C Level groups are based on statistical criteria.")
Kaplan–Meier estimation of survival by IF-CSS level (spotted lines indicate the median for each group, whereas gray zones indicate 95% confidence intervals. The p value corresponds to the log-rank result). A) Level groups were established based on clinical criteria. B and C Level groups are based on statistical criteria.
Significant differences were noted between survivors and non-survivors in all variables except for NH and sex –not included in the construct–, polypharmacy and cardiovascular, respiratory and hepatic-gastrointestinal diseases (Table 2). Depression reached statistical significance only when assessed as antidepressant therapy, whereas the risk of falls was significant only when evaluated as risk status (Tinetti test).
The parametric accelerated failure time model for predicting survival time included the variables age, sex, NH and IF-CSS with NH variable being non-significant) The model indicates a clear effect of the variable IF-CSS, estimating a 29% reduction in survival time per 0.1 increment in IF-CSS value. Assuming all other variables remain constant, the model indicates that each additional year of age reduces the probability of survival by 3%, whereas being female increases it by 26%. Fig. 4A contains survival estimations for different IF-CSS values. As shown in Fig. 4B, the residuals conform to the distribution assumed by the parametric model. The analysis of ROC curves reveals an area under the curve at 12 and 24 months of 0.76 (95%CI: 0.70–0.82) and 0.75 (95%CI: 0.71–0.80), respectively (Annex III).
DiscussionKey results Survival estimates by IF-CSS value and sex. Age is expressed as the mean. B) Graphical representation of the residuals of the parametric model.")
IF-CSS can be easily estimated and integrated into clinical practice. The construct satisfies inclusion of variables and validation criteria,20 showing an association with age, higher mean values in women, and no saturation beyond the submaximal threshold of 0.7. IF-CSS shows a right-skewed distribution indicating that a low proportion of individuals exhibited low frailty, which can be explained by NH admission requirements.
In our cohort, the probability of survival upon follow-up completion was 54.1% (95%CI: 49.3–59,4), and 85.2% had some level of frailty. Predefined frailty intervals clearly separate survival curves by frailty level, avoiding reliance on statistically derived thresholds, which are less intuitive and more complex to apply.
As expected, a clear relationship was observed between frailty and mortality. Although this finding should be interpreted with caution, the parametric model estimates a 29% decrease in survival time per 0.1 IF-CSS increment. According to the ROC curve analysis, at 12 and 24 months the model has an intermediate prognostic value, as compared to that reported by other authors.4,15,17 These differences could be explained by variability in the clinical status of the patients at the time of frailty index estimation, the care setting, and the characteristics of the cohort.
Interpretation of resultsSignificant differences were observed throughout the 38-month follow-up between survivors and non-survivors in all variables except for cardiovascular, respiratory, neurological and hepatogastrointestinal diseases and polypharmacy. The high level of frailty of the cohort would minimize the impact of diseases on a comprehensive, and especially functional, status diagnosis. . Cancer and kidney failure are exceptions, likely acting as fatal triggers in advanced stages, with treatments unable to ensure resolution or prevent chronicity. Polypharmacy is a geriatric syndrome that has been associated with mortality and frailty. However, in our study, no differences were observed in this variable between survivors and non-survivors. This could result from polypharmacy being a focus of active intervention in CGA, where treatments are adjusted to patients' evolving status. CGA interventions typically lead to a reduction in the number of medications, which is consistent with the low prevalence of excessive polypharmacy (24.9%) and would interfere with the identification of an association. In our population, the clinical effects of polypharmacy –such as frailty and mortality– may relate more to the type than to the number of medications.21 In this line, the variable "delirium," which in the construct scores antipsychotic treatment, is associated with a higher risk of failure, possibly indicating that not all medications affect these individuals in the same way.
Regarding variables classified as ‘risk’ and ‘event,’ it is noteworthy that in the variable 'risk of PU', each constituent deficit shows significant independent differences, both in the risk score (Norton ≤12) and in the presence of PUs. In contrast, differences in the variable ‘risk of falls’ were only significant in risk measurement (Tinetti), probably resulting from a high proportion of individuals with moderate-advanced frailty using a wheelchair, which significantly reduces the number of falls. In the variable 'depression', the presence of symptoms (Yesavage/Cornell) is not significant, and the use of antidepressant therapy was less frequent among non-survivors. A possible explanation is that CGA care teams frequently discontinue antidepressant therapy in patients with advanced frailty.
In relation to frailty indices proposed by other authors, the Rockwood index9 has been implemented in different care settings. However, its predictive ability seems to be reduced when used with people who have a very high number of deficits, so its appplication in NH might be less appropriate.22 Frail-NH23 is the most widely used index in NHs for detecting and staging frailty; nevertheless, as it relies on frailty phenotype, it cannot be used as a continuous variable like deficit accumulation indices. We only found a frailty index based on deficit accumulation designed specifically for the NH setting.15 It should be noted that our index contemplates fewer deficits (32 vs 27), as it accounts for a reduced set of conditions, symptoms, and sensory impairments. IF-CSS is slightly below the 30 deficits recommended for the design of the construct,20 but significantly above the 10 deficits that would result in a higher risk of instability in estimates.24
The novelty of our construct lies in the use of validated scales in CGA and in distinguishing risk and occurrence of a problem as separate deficits. This new approach may enhance the consistency of estimates, as scoring is performed as a function of the severity of patient's status. Additionally, this model has a low risk of observer bias, as the different scales are applied by a team of highly experienced professionals.
Other existing indices are intended for use in ambulatory older patients4 or long term and home care settings.10 The care setting played a major role in construct design. In view of the high level of disability and cognitive impairment of NH residents, autonomy to perform instrumental activities of daily living and self-reported measures (e.g. level of pain) were excluded from IF-CSS to avoid saturation. Other deficits excluded were the level of anxiety, insomnia, and drowsiness, as these problems may be influenced by interpretation bias. Social vulnerability was also excluded as living in a NH largely solves this potential deficit.
LimitationsThe results of this study should be interpreted considering the nature and limitation of the study design, namely:
- •
The first IF-CSS value for each patient was used for validation analysis, and their progress during follow-up was not taken into account.
- •
Disease scoring is more sensitive to subjectivity, and prescriptions are assumed to be appropriate in diseases involving a drug therapy (depression and delirium).
- •
The construct was designed for use in NH residents; therefore, their utility is restricted to this care setting.
IF-CSS exhibited an excellent power to predict mortality and capacity to discriminate frailty in the NH setting. IF-CSS is easy to apply, independent of the CGA process, and adaptable to the use of other scales if a validated equivalence is available. On the other hand, the fact that the feedback required by the construct must be provided by most of the professionals included in multidisciplinary NH teams would facilitate its incorporation into real practice.
In developing individualized care plans for NH residents, CGA is essential to identify the interventions needed to preserve the health status and functional capacity of these patients. Translating CGA into a frailty index will help care teams have a deeper understanding of patient status and quantitatively assess their progress. Hence, the use of a frailty index would support decision-making in relation to therapeutic effort, withdrawal of medication, or anticipating the need for palliative care.
Contribution to the scientific literatureIF-CSS is the first frailty index designed and validated for use in dependent older adults residing in NH in our environment. The variables included in the construct were obtained from the comprehensive geriatric assessment regularly performed by the NH multidisciplinary team. As a frailty measure, it provides insight into the situation of the patient, thereby supporting decision-making and enabling an optimized individualized care plan.
IF-CSS provides a quantitative estimation of patient status and progress over time. Stratifying frailty helps define therapeutic goals and tailor therapies. In addition, it provides an overview of the care needs of the patient for an optimal care plan. This study opens an avenue for future research on the use of medications according to patients' level of frailty and could also be used as a health outcome measure.
CRediT authorship contribution statementJuan Francisco Peris-Martí: Writing – review & editing, Writing – original draft, Visualization, Validation, Supervision, Methodology, Investigation, Formal analysis, Conceptualization. Elia Mª. Fernández-Villalba: Writing – review & editing, Writing – original draft, Validation, Supervision, Methodology, Investigation, Formal analysis, Conceptualization. Patricia Bravo-José: Writing – review & editing, Writing – original draft, Validation, Supervision, Methodology, Investigation, Formal analysis, Conceptualization. Carmen Isabel Saez-Lleó: Writing – review & editing, Writing – original draft, Validation, Methodology, Investigation, Data curation. Minerva Espert-Roig: Writing – review & editing, Validation, Supervision, Methodology, Investigation, Data curation. Pilar Martínez-Antequera: Writing – review & editing, Writing – original draft, Methodology, Investigation, Formal analysis, Data curation.
FundingThis study forms part of the Validación del Índice de Fragilidad IF-CSS research project funded by the Spanish Society of Hospital Pharmacy (FEF-ICF-2021-01 protocol) for database design and statistical analysis.
The authors declare no conflict of interest.
The authors thank the professionals at the NHs included in the study for their dedication to caring for dependent elderly people. This study would not have been possible without them. Thanks to Biostatech, Advice, Training & Innovation in Biostatistics S.L. for their essential advice, and our partners of the SEFH CRONOS working group for their constant support.

