Adverse drug reactions increase morbidity and mortality, prolong hospital stay and increase healthcare costs. The primary objective of this study was to determine the prevalence of emergency department visits for adverse drug reactions and to describe their characteristics. The secondary objective was to determine the predictor variables of hospitalization for adverse drug reactions associated with emergency department visits.
MethodsObservational and retrospective study of adverse drug reactions registered in an emergency department, carried out from November 15th to December 15th, 2021. The demographic and clinical characteristics of the patients, the drugs involved and the adverse drug reactions were described. Logistic regression was performed to identify factors related to hospitalization for adverse drug reactions.
Results10,799 patients visited the emergency department and 216 (2%) patients with adverse drug reactions were included. The mean age was 70 ± 17.5 (18-98) years and 47.7% of the patients were male. A total of 54.6% of patients required hospitalization and 1.6% died from adverse drug reactions. The total number of drugs involved was 315 with 149 different drugs. The pharmacological group corresponding to the nervous system constituted the most representative group (n = 81). High-risk medications, such as antithrombotic agents (n = 53), were the subgroup of medications that caused the most emergency department visits and hospitalization. Acenocumarol (n = 20) was the main drug involved. Gastrointestinal (n = 62) disorders were the most common. Diarrhea (n = 16) was the most frequent adverse drug reaction, while gastrointestinal bleeding (n = 13) caused the highest number of hospitalizations. Charlson comorbidity index behaved as an independent risk factor for hospitalization (aOR 3.24, 95% CI: 1.47–7.13, p = 0.003, in Charlson comorbidity index 4–6; and aOR 20.07, 95% CI: 6.87–58.64, p = 0.000, in Charlson comorbidity index ≥ 10).
ConclusionsThe prevalence of emergency department visits for adverse drug reactions continues to be a non-negligible health problem. High-risk drugs such as antithrombotic agents were the main therapeutic subgroup involved. Charlson comorbidity index was an independent factor in hospitalization, while gastrointestinal bleeding was the adverse drug reaction with the highest number of hospital admissions.
Las reacciones adversas a medicamentos aumentan la morbimortalidad, prolongan la estancia hospitalaria y aumentan los costes sanitarios. El objetivo de principal de este estudio fue determinar la prevalencia de visitas por reacciones adversas a medicamentos al servicio de urgencias y describir sus características. El objetivo secundario fue determinar las variables predictoras de hospitalización por reacciones adversas a medicamentos asociadas a visitas al servicio de urgencias.
MétodosEstudio observacional y retrospectivo de las reacciones adversas a medicamentos registradas en un servicio de urgencias, realizado del 15 de noviembre al 15 de diciembre de 2021. Se describieron las características demográficas y clínicas de los pacientes, los medicamentos involucrados y las reacciones adversas a medicamentos. Se realizó una regresión logística para identificar los factores relacionados con la hospitalización por reacciones adversas a medicamentos.
Resultados10.799 pacientes visitaron el servicio de urgencias, de los que 216 (2%) presentaban reacciones adversas a medicamentos. La edad media fue de 70 ± 17,5 (18–98) años y el 47,7% de los pacientes fueron hombres. Un 54,6% de los pacientes requirieron hospitalización y el 1,6% fallecieron a causa de una reacción adversa a medicamentos. El número total de fármacos involucrados fue de 315, con 149 fármacos diferentes. El grupo farmacológico correspondiente al sistema nervioso constituyó el grupo más representativo (n = 81). Medicamentos de alto riesgo, como los antitrombóticos (n = 53), fueron el subgrupo de medicamentos que causó más visitas a urgencias y hospitalizaciones. El acenocumarol (n = 20) fue el principal fármaco implicado. Los trastornos gastrointestinales (n = 62) fueron mayoritarios. La diarrea (n = 16) fue la reacción adversa más frecuente, mientras que la hemorragia gastrointestinal (n = 13) causó el mayor número de hospitalizaciones. El índice de comorbilidad de Charlson se comportó como un factor de riesgo independiente para hospitalización (aOR 3,24; IC 95%: 1,47–7,13; p = 0.003; en índice de comorbilidad de Charlson de 4–6 and aOR 20,07; IC 95%: 6,87–58,64 en índice de comorbilidad de Charlson ≥ 10).
ConclusionesLa prevalencia de visitas al servicio de urgencias por reacciones adversas a medicamentos continúa siendo un problema sanitario no despreciable. Medicamentos de alto riesgo como los agentes antitrombóticos fueron el principal subgrupo terapéutico implicado. El índice de comorbilidad de Charlson se comportó como un factor independiente de hospitalización, mientras que la hemorragia gastrointestinal fue la reacción adversa con mayor número de ingresos hospitalarios.
According to a recent definition, adverse drug reactions are harmful and unintended responses to medicines.1,2 The main negative consequences of adverse drug reactions are increased morbidity and mortality, prolonged hospital stay and increased healthcare costs.3,4 On the other hand, adverse drug reactions are an important cause of medicine-related emergency department visits and many of these are preventable.5,6 A fundamental step in the prevention of harm caused by adverse drug reactions is the continuous investigation and characterization of these reactions, in order to be able to implement appropriate intervention measures.7 One model of action focused on minimizing adverse drug reactions is the use of the Beers criteria to reduce potentially inappropriate prescriptions in elderly patients.8
The emergency department constitute a communication system between the hospital environment and the community, offering a valuable source of information for the study of adverse drug reactions.9 Numerous studies have been published with the aim of describing adverse drug reactions leading to emergency department visits, although data concerning risk factors contributing to hospitalization are less frequent.10–12
The primary objective of our study was to determine the prevalence of emergency department visits for adverse drug reactions and to describe their characteristics. The secondary objective was to determine the predictor variables of hospitalization associated with emergency department visits.
MethodsSetting for the study and subjectsObservational and retrospective study, carried out in the emergency department of a tertiary level university hospital, which serves a health area of approximately 550.000 inhabitants. The study period was from November 15th to December 15th, 2021. Patients over 18 years of age who attended the emergency department because of adverse drug reactions were included. Adverse drug reactions were defined as “an appreciably harmful or unpleasant reaction, resulting from an intervention related to the use of a medicinal product, which predicts hazard from future administration and warrants prevention or specific treatment, or alteration of the dosage regimen, or withdrawal of the product”.13 Adverse drug reactions triggered by self-harm attempts, recreational drug exposure or those occurring during their stay in the emergency department were excluded.
A system for recording suspected adverse drug reactions (during the diagnosis of each patient) by the clinical staff assigned to the emergency department was set up using the application software used in the emergency department (Umax®). The causality assignment of adverse drug reactions was determined by the clinical judgement of the principal investigators, including those with a fatal outcome, consisting of a pharmacist (DBN) and a clinician (MFG), applying the imputability algorithm of the Spanish Pharmacovigilance System.14 Adverse drug reactions recorded with a score equal to or higher than 4 points, according to the algorithm, considered as possible, probable, or definite adverse drug reactions, were included in the analysis. Finally, the principal investigators retrospectively analysed the cases included as adverse drug reactions, extracting information from the clinical and pharmacotherapeutic history.
OutcomesThe following variables were collected: sex, age, patient origin, triage, social problem, functional dependence (according to the Barthel index), number of adverse drug reactions per patient, main comorbidities and Charlson comorbidity index,15 number of possible drug or drugs involved, number of home drugs, route of administration, classification according to the Anatomical, Therapeutic, Chemical classification system (ATC), presence of high-risk drugs in acute care settings or high-risk drugs for chronic patients according to the classification of the Institute for Safe Medication Practices- Spain (ISMP-Spain).16 In addition, the adverse drug reactions were described using the system and organ classification (SOC) of the Medical Dictionary for Regulatory Activities (MedDRA) coding. Finally, the number of previous emergency department visits in the last year, hospitalization, duration of hospitalization, in-hospital all-cause mortality, mortality attributed to adverse drug reactions, 30 days mortality and readmission to the emergency department 30 days after discharge were collected.
Statistical analysisCategorical variables were expressed as absolute frequencies and percentages, while continuous variables were described as means, standard deviations and ranges. To identify risk factors associated with hospitalization for adverse drug reactions, two analyses were performed. First, potential demographic, clinical and treatment predictors (age, sex, Charlson comorbidity index, patient origin, functional dependence, social problem, triage, number of adverse drug reactions per patient, route of administration, high-risk drugs and high-risk drugs for chronic patients involved, number of home drugs and number of involved drug per patient) were tested to establish their relationship with hospitalization (dependent variable), using for continuous variables the nonparametric Mann-Whitney test and for categorical variables the Fisher test or the chi-square test, depending on the conditions of application. Secondly, the variables that showed a potential association (p < 0,20) were analysed using a multivariate logistic regression model. A significance level of 5% (p < 0,05) was considered. Statistical analyses were performed using SPSS Statistics software, (IBM SPSS Statistics for Windows, version 26.0. Armonk, NY: IBM Corp).
Ethical considerationsThe study was approved by the Coruña-Ferrol research ethics committee with registration code 2021/351, in accordance with the legal requirements regarding observational studies. Informed consent was not required from the patient due to the retrospective nature of the data collection.
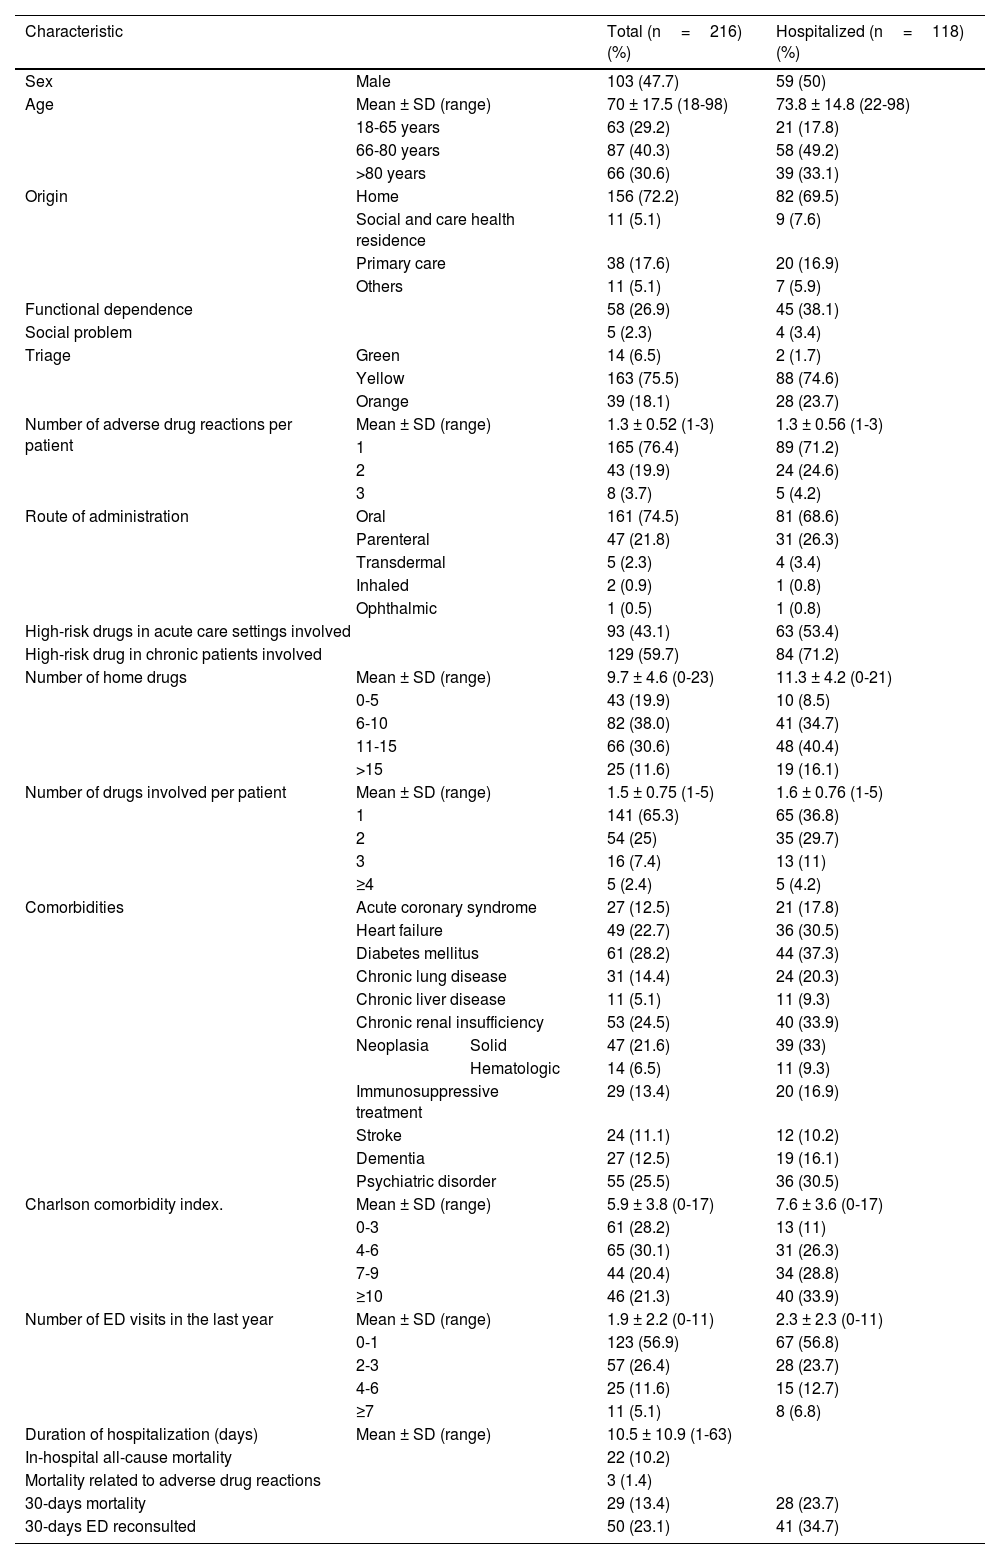
ResultsDuring the study period, 10,799 patients visited the emergency department. Initially, 243 patients with suspected adverse drug reactions were recorded by clinicians. Finally, after imputability analysis, 216 (2%) patients were included. The mean age was 70 ± 17.5 (18-98) years and 47.7% of the patients were male. Of the patients with adverse drug reactions, 54.6% (n = 118) required hospital admission. The demographic and clinical characteristics of the patients were described in Table 1.
Demographic, clinical and treatment characteristics of patients with adverse drug reactions.
| Characteristic | Total (n=216)(%) | Hospitalized (n=118)(%) | ||
|---|---|---|---|---|
| Sex | Male | 103 (47.7) | 59 (50) | |
| Age | Mean ± SD (range) | 70 ± 17.5 (18-98) | 73.8 ± 14.8 (22-98) | |
| 18-65 years | 63 (29.2) | 21 (17.8) | ||
| 66-80 years | 87 (40.3) | 58 (49.2) | ||
| >80 years | 66 (30.6) | 39 (33.1) | ||
| Origin | Home | 156 (72.2) | 82 (69.5) | |
| Social and care health residence | 11 (5.1) | 9 (7.6) | ||
| Primary care | 38 (17.6) | 20 (16.9) | ||
| Others | 11 (5.1) | 7 (5.9) | ||
| Functional dependence | 58 (26.9) | 45 (38.1) | ||
| Social problem | 5 (2.3) | 4 (3.4) | ||
| Triage | Green | 14 (6.5) | 2 (1.7) | |
| Yellow | 163 (75.5) | 88 (74.6) | ||
| Orange | 39 (18.1) | 28 (23.7) | ||
| Number of adverse drug reactions per patient | Mean ± SD (range) | 1.3 ± 0.52 (1-3) | 1.3 ± 0.56 (1-3) | |
| 1 | 165 (76.4) | 89 (71.2) | ||
| 2 | 43 (19.9) | 24 (24.6) | ||
| 3 | 8 (3.7) | 5 (4.2) | ||
| Route of administration | Oral | 161 (74.5) | 81 (68.6) | |
| Parenteral | 47 (21.8) | 31 (26.3) | ||
| Transdermal | 5 (2.3) | 4 (3.4) | ||
| Inhaled | 2 (0.9) | 1 (0.8) | ||
| Ophthalmic | 1 (0.5) | 1 (0.8) | ||
| High-risk drugs in acute care settings involved | 93 (43.1) | 63 (53.4) | ||
| High-risk drug in chronic patients involved | 129 (59.7) | 84 (71.2) | ||
| Number of home drugs | Mean ± SD (range) | 9.7 ± 4.6 (0-23) | 11.3 ± 4.2 (0-21) | |
| 0-5 | 43 (19.9) | 10 (8.5) | ||
| 6-10 | 82 (38.0) | 41 (34.7) | ||
| 11-15 | 66 (30.6) | 48 (40.4) | ||
| >15 | 25 (11.6) | 19 (16.1) | ||
| Number of drugs involved per patient | Mean ± SD (range) | 1.5 ± 0.75 (1-5) | 1.6 ± 0.76 (1-5) | |
| 1 | 141 (65.3) | 65 (36.8) | ||
| 2 | 54 (25) | 35 (29.7) | ||
| 3 | 16 (7.4) | 13 (11) | ||
| ≥4 | 5 (2.4) | 5 (4.2) | ||
| Comorbidities | Acute coronary syndrome | 27 (12.5) | 21 (17.8) | |
| Heart failure | 49 (22.7) | 36 (30.5) | ||
| Diabetes mellitus | 61 (28.2) | 44 (37.3) | ||
| Chronic lung disease | 31 (14.4) | 24 (20.3) | ||
| Chronic liver disease | 11 (5.1) | 11 (9.3) | ||
| Chronic renal insufficiency | 53 (24.5) | 40 (33.9) | ||
| Neoplasia | Solid | 47 (21.6) | 39 (33) | |
| Hematologic | 14 (6.5) | 11 (9.3) | ||
| Immunosuppressive treatment | 29 (13.4) | 20 (16.9) | ||
| Stroke | 24 (11.1) | 12 (10.2) | ||
| Dementia | 27 (12.5) | 19 (16.1) | ||
| Psychiatric disorder | 55 (25.5) | 36 (30.5) | ||
| Charlson comorbidity index. | Mean ± SD (range) | 5.9 ± 3.8 (0-17) | 7.6 ± 3.6 (0-17) | |
| 0-3 | 61 (28.2) | 13 (11) | ||
| 4-6 | 65 (30.1) | 31 (26.3) | ||
| 7-9 | 44 (20.4) | 34 (28.8) | ||
| ≥10 | 46 (21.3) | 40 (33.9) | ||
| Number of ED visits in the last year | Mean ± SD (range) | 1.9 ± 2.2 (0-11) | 2.3 ± 2.3 (0-11) | |
| 0-1 | 123 (56.9) | 67 (56.8) | ||
| 2-3 | 57 (26.4) | 28 (23.7) | ||
| 4-6 | 25 (11.6) | 15 (12.7) | ||
| ≥7 | 11 (5.1) | 8 (6.8) | ||
| Duration of hospitalization (days) | Mean ± SD (range) | 10.5 ± 10.9 (1-63) | ||
| In-hospital all-cause mortality | 22 (10.2) | |||
| Mortality related to adverse drug reactions | 3 (1.4) | |||
| 30-days mortality | 29 (13.4) | 28 (23.7) | ||
| 30-days ED reconsulted | 50 (23.1) | 41 (34.7) | ||
ED, emergency department; SD, standard deviation
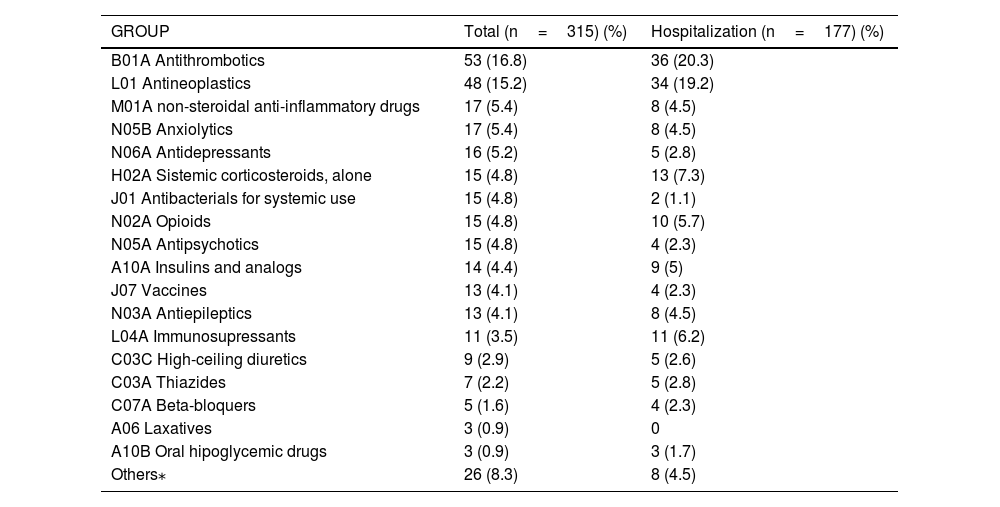
The total number of drugs involved in the adverse drug reactions was 315, with 149 different drugs and a mean number of drugs involved per patient of 1.5 ± 0.75 (range=1-5). The pharmacological group corresponding to the nervous system (group N) constituted the most representative group (n = 81) (see Table 2). On the other hand, antithrombotic agents (n = 53) were the most common subgroup (23 vitamin K antagonists, 14 direct acting anticoagulants, 12 antiplatelet agents, and 4 low molecular weight heparins) followed by antineoplastics (n = 48) (11 monoclonal antibodies, 9 platinums, 8 taxanes, 7 antimetabolites, 5 alkylating agents, 3 vinca alkaloids and others). Vaccines accounted only for 13 adverse drug reactions; 7 directed against COVID 19, of which 2 required hospital admission. The drug most frequently associated with adverse drug reactions was acenocoumarol (n = 20), followed by edoxaban (n = 7), dexamethasone (n = 7), furosemide (n = 7), quetiapine (n = 6), paclitaxel (n = 6) and fentanyl (n = 6). Regarding hospital admission, the groups of drugs with the highest participation in order were: antithrombotic agents (n = 36), antineoplastics (n = 34), systemic corticosteroids (n = 13) and immunosuppressants (n = 11); this last with an admission rate of 100%. Acenocoumarol (n = 12), followed by dexamethasone (n = 6), edoxaban (n = 5), fentanyl (n = 5), pembrolizumab (n = 4), and tacrolimus (n = 4) constituted the drugs most frequently associated with hospitalizations.
Classification of drugs involved in adverse drug reactions by therapeutic groups according to ATC code (n=315).
| GROUP | Total (n=315) (%) | Hospitalization (n=177) (%) |
|---|---|---|
| B01A Antithrombotics | 53 (16.8) | 36 (20.3) |
| L01 Antineoplastics | 48 (15.2) | 34 (19.2) |
| M01A non-steroidal anti-inflammatory drugs | 17 (5.4) | 8 (4.5) |
| N05B Anxiolytics | 17 (5.4) | 8 (4.5) |
| N06A Antidepressants | 16 (5.2) | 5 (2.8) |
| H02A Sistemic corticosteroids, alone | 15 (4.8) | 13 (7.3) |
| J01 Antibacterials for systemic use | 15 (4.8) | 2 (1.1) |
| N02A Opioids | 15 (4.8) | 10 (5.7) |
| N05A Antipsychotics | 15 (4.8) | 4 (2.3) |
| A10A Insulins and analogs | 14 (4.4) | 9 (5) |
| J07 Vaccines | 13 (4.1) | 4 (2.3) |
| N03A Antiepileptics | 13 (4.1) | 8 (4.5) |
| L04A Immunosupressants | 11 (3.5) | 11 (6.2) |
| C03C High-ceiling diuretics | 9 (2.9) | 5 (2.6) |
| C03A Thiazides | 7 (2.2) | 5 (2.8) |
| C07A Beta-bloquers | 5 (1.6) | 4 (2.3) |
| A06 Laxatives | 3 (0.9) | 0 |
| A10B Oral hipoglycemic drugs | 3 (0.9) | 3 (1.7) |
| Others⁎ | 26 (8.3) | 8 (4.5) |
ATC; Anatomical Therapeutic Chemical classification system.
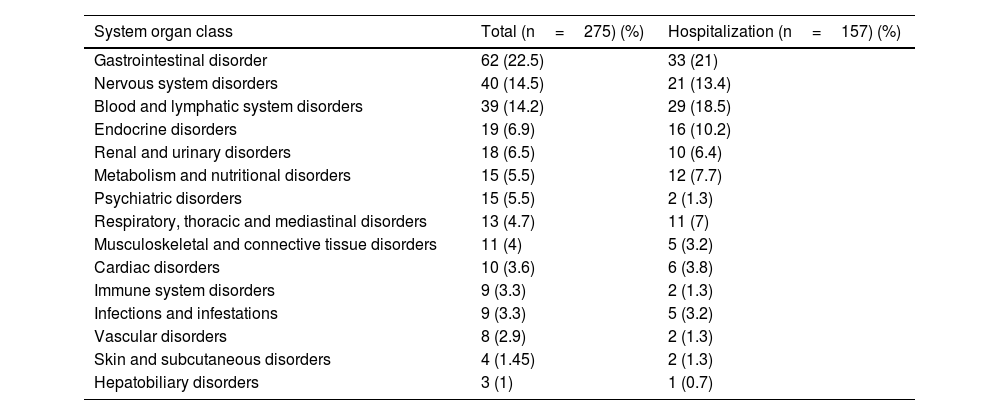
The adverse drug reactions collected and catalogued according to the SOC are shown in Table 3. Gastrointestinal (n = 62) and neurological (n = 40) disorders were the major groups of adverse reactions. Diarrhea (n = 16) represented the most frequent, while gastrointestinal haemorrhage (n = 13) caused the highest number of hospitalizations.
System organ classification of the adverse drug reactions collected.
| System organ class | Total (n=275) (%) | Hospitalization (n=157) (%) |
|---|---|---|
| Gastrointestinal disorder | 62 (22.5) | 33 (21) |
| Nervous system disorders | 40 (14.5) | 21 (13.4) |
| Blood and lymphatic system disorders | 39 (14.2) | 29 (18.5) |
| Endocrine disorders | 19 (6.9) | 16 (10.2) |
| Renal and urinary disorders | 18 (6.5) | 10 (6.4) |
| Metabolism and nutritional disorders | 15 (5.5) | 12 (7.7) |
| Psychiatric disorders | 15 (5.5) | 2 (1.3) |
| Respiratory, thoracic and mediastinal disorders | 13 (4.7) | 11 (7) |
| Musculoskeletal and connective tissue disorders | 11 (4) | 5 (3.2) |
| Cardiac disorders | 10 (3.6) | 6 (3.8) |
| Immune system disorders | 9 (3.3) | 2 (1.3) |
| Infections and infestations | 9 (3.3) | 5 (3.2) |
| Vascular disorders | 8 (2.9) | 2 (1.3) |
| Skin and subcutaneous disorders | 4 (1.45) | 2 (1.3) |
| Hepatobiliary disorders | 3 (1) | 1 (0.7) |
Three patients had a fatal outcome directly attributed to adverse drug reactions. One case because of severe neutropenic enterocolitis related to the administration of cisplatin, etoposide and bleomycin; a severe anemia secondary to gastrointestinal bleeding related to edoxaban in a frail patient; and finally a subdural haemorrhage due to acenocoumarol with an INR of 12.7, in a 79-year-old patient.
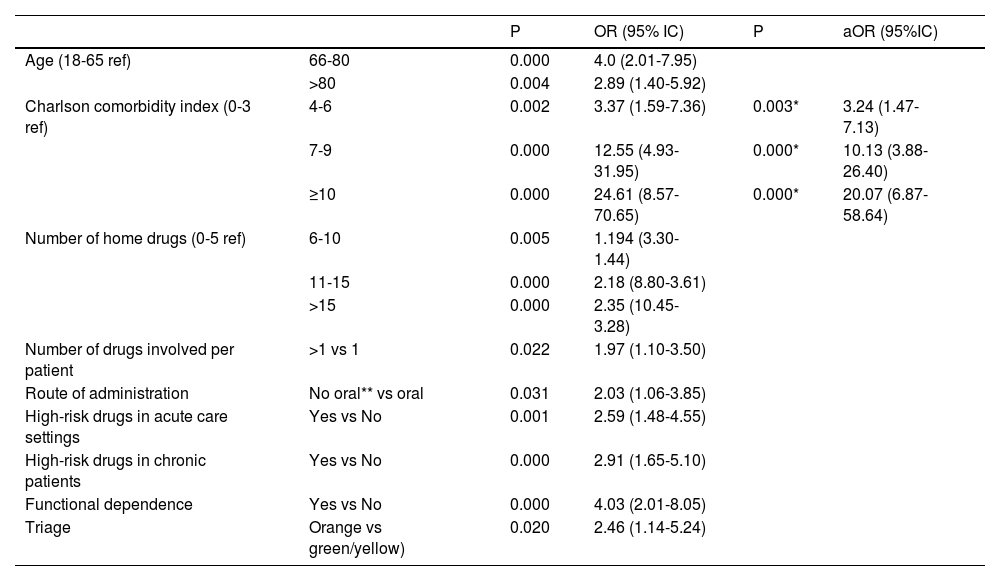
Charlson comorbidity index behaved as a risk factor related to hospitalization for adverse drug reactions according to adjusted logistic regression analysis (aOR 3.24 95% CI:1.47-7.13, in Charlson comorbidity index 4-6; and aOR 20.07; 95% CI:6.87-58.64 6,87-58,64 in Charlson comorbidity index ≥ 10) (see Table 4).
Univariate and multivariate analysis of predictor variables of hospitalization for adverse drug reactions.
| P | OR (95% IC) | P | aOR (95%IC) | ||
|---|---|---|---|---|---|
| Age (18-65 ref) | 66-80 | 0.000 | 4.0 (2.01-7.95) | ||
| >80 | 0.004 | 2.89 (1.40-5.92) | |||
| Charlson comorbidity index (0-3 ref) | 4-6 | 0.002 | 3.37 (1.59-7.36) | 0.003* | 3.24 (1.47-7.13) |
| 7-9 | 0.000 | 12.55 (4.93-31.95) | 0.000* | 10.13 (3.88-26.40) | |
| ≥10 | 0.000 | 24.61 (8.57-70.65) | 0.000* | 20.07 (6.87-58.64) | |
| Number of home drugs (0-5 ref) | 6-10 | 0.005 | 1.194 (3.30-1.44) | ||
| 11-15 | 0.000 | 2.18 (8.80-3.61) | |||
| >15 | 0.000 | 2.35 (10.45-3.28) | |||
| Number of drugs involved per patient | >1 vs 1 | 0.022 | 1.97 (1.10-3.50) | ||
| Route of administration | No oral** vs oral | 0.031 | 2.03 (1.06-3.85) | ||
| High-risk drugs in acute care settings | Yes vs No | 0.001 | 2.59 (1.48-4.55) | ||
| High-risk drugs in chronic patients | Yes vs No | 0.000 | 2.91 (1.65-5.10) | ||
| Functional dependence | Yes vs No | 0.000 | 4.03 (2.01-8.05) | ||
| Triage | Orange vs green/yellow) | 0.020 | 2.46 (1.14-5.24) | ||
OR, odds ratio; aOR, adjusted odds ratio for all variables.
Our work provides valuable information on the prevalence of emergency department visits due to adverse drug reactions, the profile of patients at greatest risk of hospitalization and the main therapeutic groups involved. The continued development of pharmacovigilance studies is essential to understand the health burden of adverse drug reactions and to design interventional measures to prevent them.17 The epidemiology of adverse drug reactions visits previously published in the literature varies from 1.3% to 41.3%, in the general population.18 The prevalence shown in our study is 2%, lower than other studies performed in our country.19–20 This variability can be partly explained by the different inclusion criteria for adverse drug reactions in each study and the differences between prospective and retrospective methodology. Prospective studies involve a more active and interventional search for adverse drug reactions by a team of investigators, whereas retrospective studies are limited to a registry usually conducted by a clinician, underestimating adverse reactions.21–22 Therefore, a significant proportion of emergency department visits related to drugs are not considered by emergency physicians and may go unnoticed,23 especially when the drug is implicated in a multifactorial pathological process.24
Our study population was characterised by advanced age, with 70% of patients over 65 years of age and marked dependency (a quarter of patients had some degree of functional dependency), both factors related to adverse drug reactions.25 In addition, polymedication and comorbidity played an important role, with a patient profile very similar to the national multicentre registry of adverse drug events in the emergency department, recently conducted by the Working Group on Pharmaceutical Care in the Emergency Department of the Spanish Society of Hospital Pharmacy (REDFASTER).26 These circumstances may partly justify a slightly higher rate of hospitalization for adverse drug reactions compared to other previously published registries, represented by a less frail and aging population.10,11
Charlson comorbidity index was the only risk factor for hospitalization that was statistically significant in the multivariate analysis, confirming that comorbidity may be associated with the presence of severe adverse drug reactions.27 On the other side, age and comorbidity are variables that go hand in hand, with polypharmacy being a consequence of both.28,29 In our study, polypharmacy and age did not behave as independent variables of hospitalization, possibly due to the smaller sample size compared to previous studies.8,9 Mortality associated with adverse drug reactions obtained from pharmacovigilance registries is around 1%, and antineoplastics played an important role.30
In addition, drugs classified as high-risk drugs according to ISMP-Spain,16 those most likely to cause serious harm when used incorrectly, were involved in almost 60% and more than 40% of patients, respectively. Finally, one out of every 3 patients included in the study was readmitted to the emergency department 30 days after discharge. These circumstances highlight the importance of implementing action measures in all the processes of the drug utilization chain, from prescription to dispensing, administration, treatment follow-up and education for both patients and caregivers.
Coinciding with the evidence of studies carried out in our country, the pharmacological group belonging to the nervous system (group N according to the ATC classification) was the group most frequently associated with adverse drug reactions.19,20 On the other hand, according to the subgroup category, antithrombotic agents, including the new oral anticoagulants, caused the majority of visits and hospitalizations, with acenocoumarol being the main drug involved. Very similar data were shown by the national multicentre registry of Ruiz-Ramos et al, previously mentioned,26 in addition to international studies.5,11,27 It is worth noting the high presence of adverse reactions caused by cytostatics, a consequence of a population marked by a notable existence of neoplasms. This fact may justify that almost half of the drugs involved were considered as high-risk drugs, in addition to a notable presence of the parenteral route.
With respect to the SOC classification of adverse drug reactions, gastrointestinal and nervous system disorders were among the main adverse reaction observed, while gastrointestinal bleeding caused by antithrombotic agents were the adverse reactions with the highest number of hospitalizations in our study. These results were very similar to those shown by 2 multicentre pharmacovigilance registries carried out in Italy.10,11
Our study has some limitations. Firstly, the study was conducted in a single centre and during winter, with consequent seasonality biases. Furthermore, our work is retrospective in nature and could be influenced by selection bias, where the recording of adverse drug reactions may be underestimated, due to the difficulty for clinicians to recognize reactions masked by multifactorial processes, where rigorous diagnostic evaluation would be necessary. In addition, this bias may explain the high hospitalization observed in our study, as the most severe adverse drug reactions are usually recorded. Finally, the principal investigators did not classify adverse drug reactions according to causal category and did not use any algorithm to determine their avoidability.
In conclusion, although the observed prevalence of emergency department visits for adverse drug reactions is low compared to other studies, it remains a non-negligible health problem. High-risk drugs such as antithrombotic agents are the main therapeutic subgroup involved. In addition, Charlson comorbidity index is an independent predictor of hospitalization for adverse drug reactions, while gastrointestinal bleeding is the adverse reaction with the highest number of hospital admissions. More pharmacovigilance studies are needed to provide healthcare professionals with knowledge about adverse drug reactions to design and implement appropriate and up-to-date intervention and prevention measures.
Patient consent statementThe institutional review board granted a waiver of informed consent due to retrospective data collection.
FundingThe authors received no funding.
Not declare.

