

Deep remission defined by clinical-biomarker remission and mucosal healing has emerged as a new therapeutic target in inflammatory bowel disease. The aim of this study was to define an optimal cut-off concentration for infliximab and adalimumab during maintenance therapy associated with deep remission. The secondary objective, was to evaluate the influence of variables on anti tumor necrosis factor-alpha concentrations and deep remission.
MethodRetrospective study including 120 and 122 patients inflammatory bowel disease diagnosed who received maintenance therapy with infliximab and adalimumab. Biomarker remission was considered by C-reactive protein < 5 mg/L and fecal calprotectin < 100 µg/g. Crohn's disease clinical remission was defined by a Harvey Bradshaw score < 5 and mucosal healing by a simple endoscopic score for Crohn's disease< 3. In ulcerative colitis, it was defined as a Mayo total score < 3 and Mayo endoscopic subscore < 2. Receiver operating characteristic test was performed to determine drug concentration thresholds associated with deep remission. Anti tumor necrosis factor-alpha concentrations were classified into quartiles. X2 and Kruskal-Wallis test were used to compare discrete and continuous variables between quartile groups. Multivariate logistic regression was performed to identify patient characteristics and serological facto C-reactive protein rs associated with deep remission.
ResultsAnti tumor necrosis factor-alpha concentrations were higher in patients with deep remission, in infliximab (4.4, interquartile range: 3.3-6.5 vs 2.3, interquartile range: 1.1-4.2 µg/mL, P < 0.005) and adalimumab (6.3, interquartile range: 4.2-8.2 vs 3.9, interquartile range: 2.4-5.5 µg/mL, P < 0.005). A Receiver operating characteristic test identified a concentration threshold of 3.1 µg/mL in infliximab (area under the Receiver operating characteristic test curve, 0.72) and 6.3 µg/mL in adalimumab (area under receiver operating characteristic test curve, 0.75) associated with deep remission. Factors associated with the highest quartiles of serum infliximab concentration were: elevated body mass index, absence of previous inflammatory bowel disease-surgery, C-reactive protein < 5 mg/L, and fecal calprotectin < 100 µg/g. In adalimumab, higher quartiles were related to concomitant immunosuppressants, low body mass index, absence of previous inflammatory bowel disease-surgery, and C-reactive protein < 5 mg/L and fecal calprotectin < 100 µg/g. Multivariate regression identified fecal calprotectin < 100 µg/g, C-reactive protein < 5 mg/L, infliximab > 3.1 µg/mL and adalimumab concentrations > 6.3 µg/mL as factors significantly associated with deep remission.
ConclusionsTrough infliximab and adalimumab concentrations, C-reactive protein < 5 mg/L and fecal calprotectin < 100 µg/g are associated with deep remission during maintenance therapy. Cutoff point of 3.1 and 6.3 g/mL for infliximab and adalimumab respectively, were identified as deep remission predictors.
La remisión profunda, definida como remisión clínico-analítica y curación de la mucosa, es el objetivo terapéutico en la enfermedad inflamatoria intestinal. En este estudio se define el punto de corte óptimo de concentración valle de infliximab y adalimumab asociado a remisión profunda en fase de mantenimiento. El objetivo secundario es evaluar las covariables relacionadas con las concentraciones de antifactor de necrosis tumoral y la remisión profunda.
MétodoEstudio retrospectivo que incluyó 120 y 122 pacientes diagnosticados de enfermedad inflamatoria intestinal tratados con infliximab y adalimumab. La proteína C reactiva < 5 mg/l y la calprotectina fecal < 100 µg/g se consideró para remisión analítica. En la enfermedad de Crohn, la remisión clínica se definió mediante puntuación Harvey Bradshaw < 5; la curación de la mucosa por puntuación endoscópica simple para enfermedad de Crohn < 3; en colitis ulcerosa, por índice total de Mayo < 3 e índice subendoscópico de Mayo < 2. Se realizó un análisis por curva de eficacia diagnóstica para determinar el cutoff asociado a remisión profunda. Las concentraciones de antifactor de necrosis tumoral se clasificaron en cuartiles. Se utilizó la prueba X2 y Kruskal-Wallis para comparar variables discretas o continuas. Se realizó una regresión logística multivariante para identificar las características de pacientes y serológicas asociadas a remisión profunda.
ResultadosSLas concentraciones de antifactor de necrosis tumoral fueron superiores en remisión profunda en comparación con los que no la alcanzaron en infliximab (4,4; rango intercuartílico: 3,3-6,5 versus 2,3; rango intercuartílico: 1,1-4,2 pg/ml; P < 0,005) y adalimumab (6,3; rango intercuartílico: 4,2-8,2 versus 3,9; rango intercuartílico: 2,4-5,5 pg/ml; P < 0,005). Se identificó un cutoff de 3,1 pg/ml en infliximab (área bajo la curva de eficacia diagnóstica 0,72), y 6,3 pg/ml en adalimumab (área bajo la curva de eficacia diagnóstica 0,75). Los factores asociados a concentraciones más elevadas de infliximab fueron: elevado índice de masa corporal, ausencia de cirugía previa de enfermedad inflamatoria intestinal, proteína C reactiva < 5 mg/l y calprotectina fecal < 100 µg/g. En adalimumab, concentraciones más altas se relacionaron con coadministración de inmunosupresores, bajo índice de masa corporal, ausencia de cirugía previa, proteína C reactiva < 5 mg/l y calprotectina fecal < 100 µg/g. Se identificó calprotectina fecal < 100 µg/g, proteína C reactiva < 5 mg/l, infliximab > 3,1 pg/ml y adalimumab > 6,3 pg/ml como factores asociados a remisión profunda.
ConclusionesLas concentraciones valle de infliximab y adalimumab, proteína C reactiva < 5 mg/l y calprotectina fecal < 100 µg/g se asocian a remisión profunda. Se identifican concentraciones cutoff de 3,1 y 6,3 pg/ml en infliximab y adalimumab, respectivamente, como predictoras de remisión profunda.
Crohn's disease (CD) and ulcerative colitis (UC) are the two main types of chronic inflammatory bowel disease (IBD). Although their etiology remains unknown, studies have found an high concentration of tumor necrosis factor-alpha (TNF-α) in both CD and UC compared to controls1. In this regard, anti-TNF is an effective therapy to induce and maintain clinical remission as well as mucosa healing (MH).
Adalimumab (ADA) and infliximab (IFX) are the first-line anti-TNF drugs in case of inadequate response to conventional treatments in patients with moderately to severely active IBD. Although pharmacological options have increased in recent years with new biologic drugs (ustekinumab, vedolizumab…) and JAK inhibitors such as tofacitinib2, the available lines after failure of anti-TNF agents are limited.
However, about 10-30% of IBD patients treated with anti-TNF do not respond to induction therapy (primary non-response), while 23-46% of patients who are in remission lose response (LOR) during treatment (secondary LOR). The most common mechanism implicated in the development of LOR is the formation of antibodies against anti-TNF that interfere with TNF binding, accelerate drug clearance and correlate with lower serum drug concentrations and shorter duration of response3. The rate of LOR after 12 months ranges from 23% to 46% in CD patients treated with IFX or ADA4. Consequently, approximately 25% of CD patients experience LOR to IFX during the first year of maintenance therapy5. In addition, the pharmacokinetics of anti-TNFs are highly variable among patients and could be influenced by many factors, such as serum albumin, gender, body mass index (BMI), systemic inflammation and coadministration of immunosuppressive drugs (IMM)6.
Serum concentrations of these anti-TNFs have been correlated with improved clinical outcomes7. Since healthcare expenditure in IBD have been mainly attributed to drug treatment costs8, therapeutic drug monitoring (TDM) could be important in reducing healthcare costs without negatively impacting efficacy9. Deep remission (DR) defined as biomarker remission, clinical remission and mucosal healing has emerged as a new therapeutic target in IBD10. However, an optimal cutoff concentration of IFX and ADA predictive of DR has not been clearly defined.
The aim of this study was to define an optimal serum through concentrations cut-off point for IFX and ADA during maintenance therapy associated with DR in IBD. The secondary objective, was to evaluate the influence of sociodemographic, clinical, pharmacological and biomarker variables on anti-TNF concentrations and DR.
MethodsStudy design, definitions and patient populationThis is a retrospective, observational, single-center study that included adult patients with CD or UC who received IFX or ADA at the Castellón General University Hospital from December 2013 to December 2020. All consecutive adults included were responders to induction with IFX or ADA and were treated by maintenance strategy. The maintenance dose of IFX ranged from 5 to 10 mg/kg and ranged every 6 to 8 weeks. The ADA dose was 40 mg and was administered with a dosing interval ranging from every two weeks to every week.
The cohort population underwent endoscopic examination and TDM. Endoscopic evaluations were performed no more than 5 days prior to measurement of the minimum IFX or ADA concentration. Assessment of clinical disease activity and serology determination were performed on the day of measurement of the trough IFX or ADA concentration. Patients in whom the dose was not stable for at least 3 months on IFX and 1 month on ADA prior to the measurement of the minimum concentration were excluded. Analytical and treatment data were reviewed from patients’ electronic medical records until March 2021. The study was approved by the department's Drug Research Ethics Committee.
Deep remission definitionsDR was defined as analytical and clinical remission, as well as MH. C-reactive protein (CRP) < 5 mg/L and fecal calprotectin (FC) < 100 µg/g were criteria to analytical remission. In CD, clinical remission was defined by Harvey Bradshaw (HB) score < 5 and MH by simple endoscopic score for CD (SES-CD) < 3. The diagnostic study was supported by magnetic enteroresonance imaging in patients with ileal disease. In UC, a Mayo total score < 3 and MH was defined by Mayo endoscopic subscore < 2.
Therapeutic Drug MonitoringIFX and ADA serum samples were routinely and systematically collected in the Pharmacokinetics Area of the Pharmacy Department. Samples were drawn just before the next administration of IFX or ADA (minimum concentration) in serum separator tubes. After centrifugation (1500 x g for 10 minutes), the serum was aliquoted into two labeled polypropylene Eppendorf tubes and stored at -20 °C until analysis. TDM was performed at steady state during maintenance treatment, and samples were drawn from week 30 of initiation of anti-TNF treatment.
Trough concentrations of anti-TNF and antibodies to IFX (ATI) and ADA (ATA) were measured using an automated, clinically validated Lisa-Tracker® enzyme-linked immunosorbent assay kit (Theradiag Laboratories®). This technique measures the concentrations of free TNF-α inhibitor and free anti-drug antibodies11. The lower limit of detection for anti-TNF trough concentration was 0.3 µg/mL and 10 ng/mL for anti-drug antibodies.
Baseline variables and serologyBaseline variables such as sex, age at diagnosis, diagnosis, perianal fistulizing, Montreal Classification for UC and EC, and previous biologic therapy were recorded. Duration of anti-TNF, prior biologic therapy, concomitant corticosteroids (CS) and IMM, smoking, weigh, BMI, CRP, FC, DR, clinical remission, MH, and biochemical variables (hemoglobin, white blood cell count, neutrophils, platelets, albumin) were determined on the day of TDM specimen extraction.
Statistical analysisDemographic characteristics were provided with medians and interquartile range (IQR) for continuous variables and frequency and percentage for categorical variables. When considering serum IFX and ADA concentrations, a receiver operating characteristic (ROC) analysis was performed using the DR as a classification variable to calculate sensitivity, specificity, positive predictive value (PPV), negative predictive value (NPV), likelihood ratio (LR) and area under the ROC curve (AUROC) with associated P-value. ADA and IFX concentrations were compared between groups with the Mann-Whitney U test according to DR. DR rates were compared between into concentration increments of anti-TNF using the X2 test. Serum anti-TNF concentrations were also classified into quartiles. The X2 test and Kruskal-Wallis test were used to compare discrete or continuous variables between quartile groups. The X2 test and Mann-Whitney test were used for univariate assessment to determine categorical or quantitative variables associated with DR, respectively. Multivariate binary logistics was performed including the variables from the univariate analysis with a P value < 0.1, following the backward Wald method to identify the independent variables associated with DR. Results were expressed as odds ratio (OR) with 95% confidence intervals (95% CI), and P values.
A P value of P < 0.05 was selected to consider the results statistically significant. All statistical performance was analyzed using STATA (version 14.0).
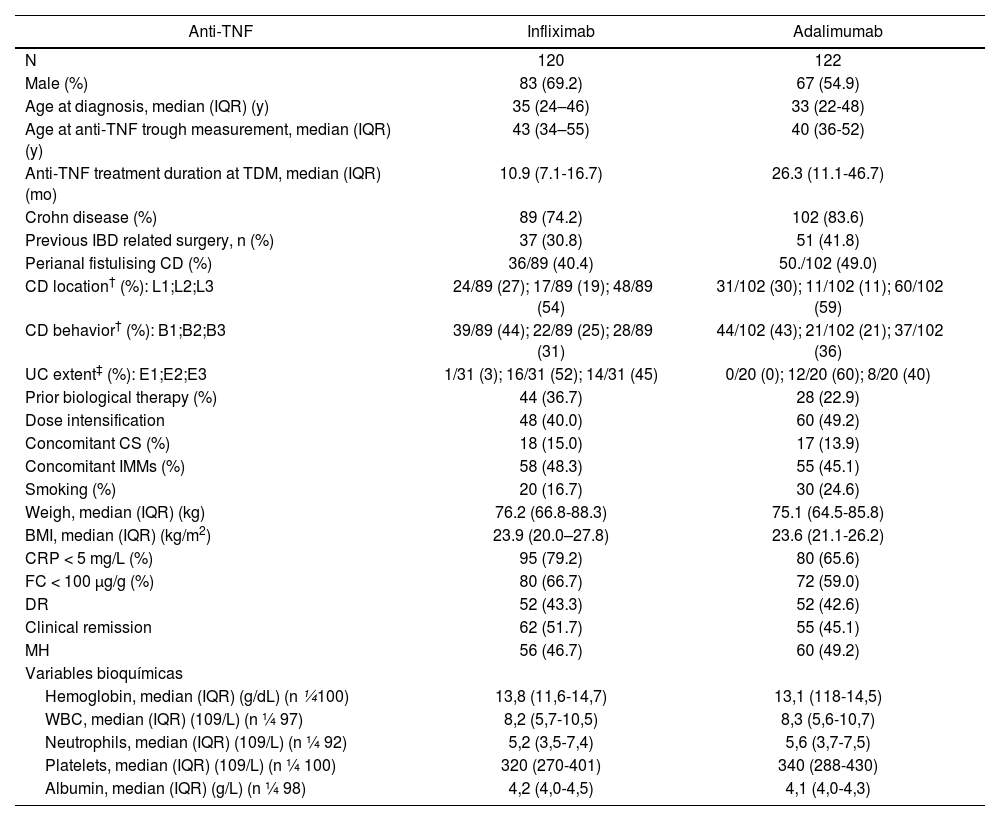
ResultsStudy population120 and 122 patients treated with IFX and ADA, respectively, were included. Most patients had analytical remission according to CRP < 5 mg/L (IFX, n = 95, 79.2%) (ADA, n = 80, 65.6%) and FC < 100 µg/g (IFX, n = 80, 66.7%) (ADA, n = 72, 59.0%). DR was achieved in 52 of 120 (43.3%) and 52 of 122 (42.6%) patients with IFX and ADA, respectively. Disease and patient characteristics are listed in table 1.
Patient characteristics
| Anti-TNF | Infliximab | Adalimumab |
|---|---|---|
| N | 120 | 122 |
| Male (%) | 83 (69.2) | 67 (54.9) |
| Age at diagnosis, median (IQR) (y) | 35 (24–46) | 33 (22-48) |
| Age at anti-TNF trough measurement, median (IQR) (y) | 43 (34–55) | 40 (36-52) |
| Anti-TNF treatment duration at TDM, median (IQR) (mo) | 10.9 (7.1-16.7) | 26.3 (11.1-46.7) |
| Crohn disease (%) | 89 (74.2) | 102 (83.6) |
| Previous IBD related surgery, n (%) | 37 (30.8) | 51 (41.8) |
| Perianal fistulising CD (%) | 36/89 (40.4) | 50./102 (49.0) |
| CD location† (%): L1;L2;L3 | 24/89 (27); 17/89 (19); 48/89 (54) | 31/102 (30); 11/102 (11); 60/102 (59) |
| CD behavior† (%): B1;B2;B3 | 39/89 (44); 22/89 (25); 28/89 (31) | 44/102 (43); 21/102 (21); 37/102 (36) |
| UC extent‡ (%): E1;E2;E3 | 1/31 (3); 16/31 (52); 14/31 (45) | 0/20 (0); 12/20 (60); 8/20 (40) |
| Prior biological therapy (%) | 44 (36.7) | 28 (22.9) |
| Dose intensification | 48 (40.0) | 60 (49.2) |
| Concomitant CS (%) | 18 (15.0) | 17 (13.9) |
| Concomitant IMMs (%) | 58 (48.3) | 55 (45.1) |
| Smoking (%) | 20 (16.7) | 30 (24.6) |
| Weigh, median (IQR) (kg) | 76.2 (66.8-88.3) | 75.1 (64.5-85.8) |
| BMI, median (IQR) (kg/m2) | 23.9 (20.0–27.8) | 23.6 (21.1-26.2) |
| CRP < 5 mg/L (%) | 95 (79.2) | 80 (65.6) |
| FC < 100 μg/g (%) | 80 (66.7) | 72 (59.0) |
| DR | 52 (43.3) | 52 (42.6) |
| Clinical remission | 62 (51.7) | 55 (45.1) |
| MH | 56 (46.7) | 60 (49.2) |
| Variables bioquímicas | ||
| Hemoglobin, median (IQR) (g/dL) (n ¼100) | 13,8 (11,6-14,7) | 13,1 (118-14,5) |
| WBC, median (IQR) (109/L) (n ¼ 97) | 8,2 (5,7-10,5) | 8,3 (5,6-10,7) |
| Neutrophils, median (IQR) (109/L) (n ¼ 92) | 5,2 (3,5-7,4) | 5,6 (3,7-7,5) |
| Platelets, median (IQR) (109/L) (n ¼ 100) | 320 (270-401) | 340 (288-430) |
| Albumin, median (IQR) (g/L) (n ¼ 98) | 4,2 (4,0-4,5) | 4,1 (4,0-4,3) |
BMI: body mass index; CRP: C-reactive protein; CS: corticosteroids; DR: deep remission; FC: fecal calprotectin; IMMs: concomitant immunosuppressive; IQR: interquartile range; MH: mucosa healing; mo: months; WBC: white blood count; y: years.
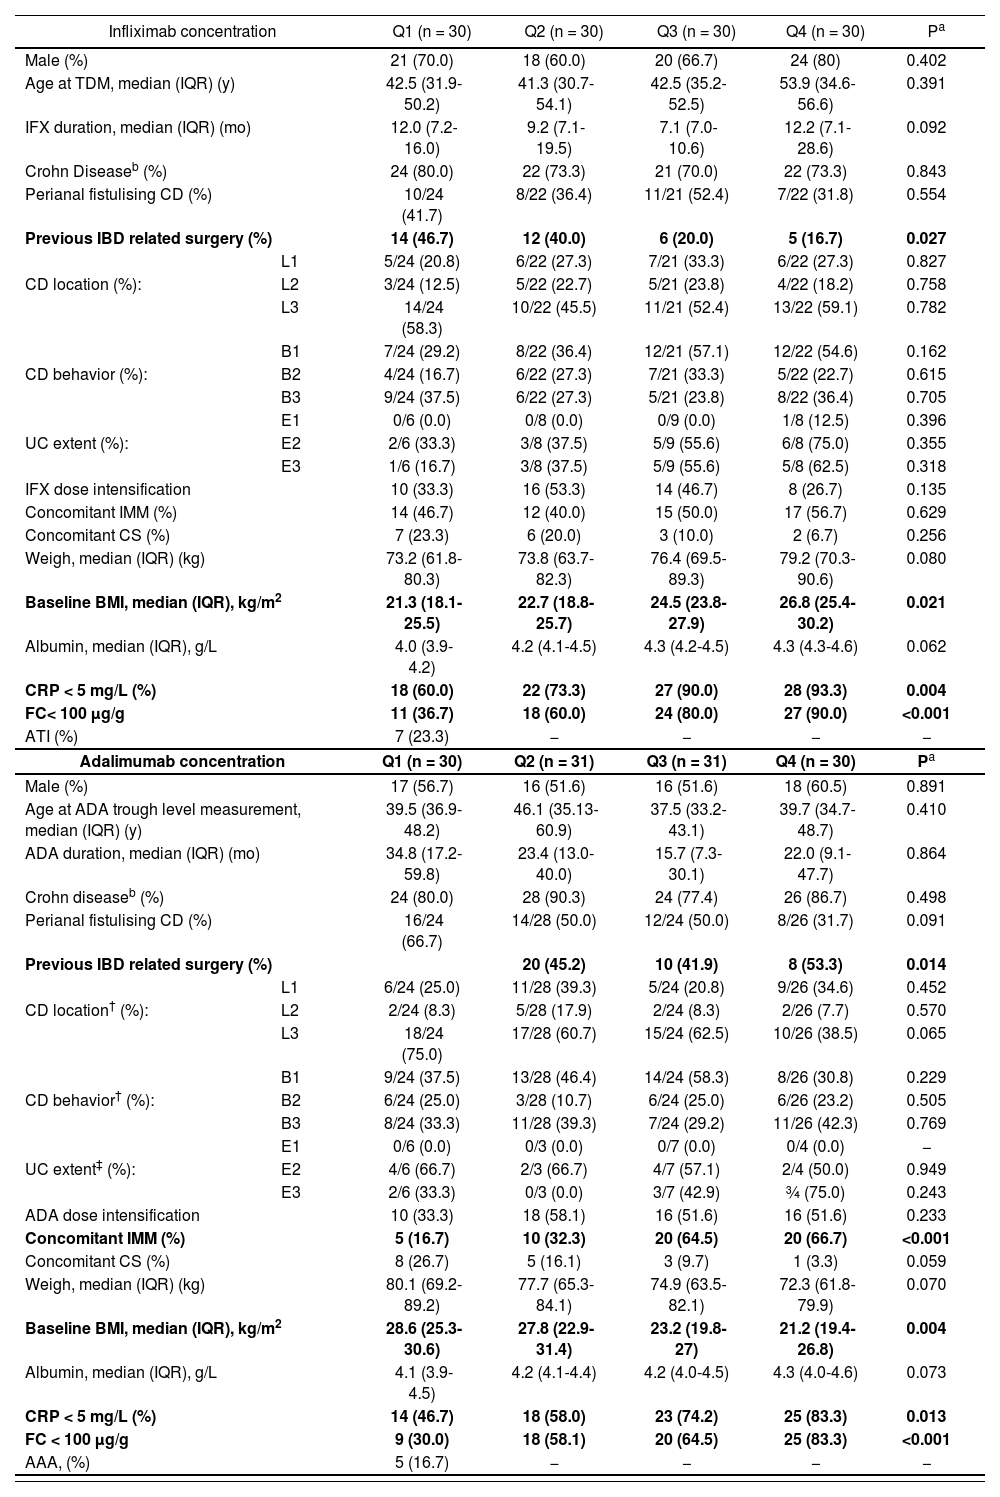
Median (IQR) anti-TNF trough concentrations were significantly higher in patients with DR compared to those without, in IFX (4.4, IQR: 3.3-6.5 vs 2.3, IQR: 1.1-4.2 µg/mL, P < .005) and ADA (6.3, IQR: 4.2-8.2 vs 3.9, IQR: 2.4-5.5 µg/mL, P < .005). A ROC curve analysis identified statistically significant concentration thresholds of 3.1 in IFX and 6.3 µg/mL in ADA associated with DR (Figure 1). Higher serum anti-TNF concentration was associated with higher rates of DR in IFX and ADA (Figure 2). Factors associated with quartiles of serum anti-TNF concentrations are depicted in table 2. Factors associated with higher IFX concentrations were high BMI, absence of previous IBD-related surgery, CRP concentrations < 5 mg/L and FC < 100 µg/g. In ADA, concomitant IMM, low BMI, absence of previous IBD-related surgery, and CRP concentrations < 5 mg/L and FC < 100 µg/g were associated with concomitant IMM.
.")
.")
Rates of deep remission by trough concentrations increments of 3 µg/mL in infliximab and adalimumab (P values indicate comparison across concentrations, X2 test (linear-by-linear association).
Summary of factors associated with serum IFX and ADA concentrations quartiles.
| Infliximab concentration | Q1 (n = 30) | Q2 (n = 30) | Q3 (n = 30) | Q4 (n = 30) | Pa | |
|---|---|---|---|---|---|---|
| Male (%) | 21 (70.0) | 18 (60.0) | 20 (66.7) | 24 (80) | 0.402 | |
| Age at TDM, median (IQR) (y) | 42.5 (31.9-50.2) | 41.3 (30.7-54.1) | 42.5 (35.2-52.5) | 53.9 (34.6-56.6) | 0.391 | |
| IFX duration, median (IQR) (mo) | 12.0 (7.2-16.0) | 9.2 (7.1-19.5) | 7.1 (7.0-10.6) | 12.2 (7.1-28.6) | 0.092 | |
| Crohn Diseaseb (%) | 24 (80.0) | 22 (73.3) | 21 (70.0) | 22 (73.3) | 0.843 | |
| Perianal fistulising CD (%) | 10/24 (41.7) | 8/22 (36.4) | 11/21 (52.4) | 7/22 (31.8) | 0.554 | |
| Previous IBD related surgery (%) | 14 (46.7) | 12 (40.0) | 6 (20.0) | 5 (16.7) | 0.027 | |
| L1 | 5/24 (20.8) | 6/22 (27.3) | 7/21 (33.3) | 6/22 (27.3) | 0.827 | |
| CD location (%): | L2 | 3/24 (12.5) | 5/22 (22.7) | 5/21 (23.8) | 4/22 (18.2) | 0.758 |
| L3 | 14/24 (58.3) | 10/22 (45.5) | 11/21 (52.4) | 13/22 (59.1) | 0.782 | |
| B1 | 7/24 (29.2) | 8/22 (36.4) | 12/21 (57.1) | 12/22 (54.6) | 0.162 | |
| CD behavior (%): | B2 | 4/24 (16.7) | 6/22 (27.3) | 7/21 (33.3) | 5/22 (22.7) | 0.615 |
| B3 | 9/24 (37.5) | 6/22 (27.3) | 5/21 (23.8) | 8/22 (36.4) | 0.705 | |
| E1 | 0/6 (0.0) | 0/8 (0.0) | 0/9 (0.0) | 1/8 (12.5) | 0.396 | |
| UC extent (%): | E2 | 2/6 (33.3) | 3/8 (37.5) | 5/9 (55.6) | 6/8 (75.0) | 0.355 |
| E3 | 1/6 (16.7) | 3/8 (37.5) | 5/9 (55.6) | 5/8 (62.5) | 0.318 | |
| IFX dose intensification | 10 (33.3) | 16 (53.3) | 14 (46.7) | 8 (26.7) | 0.135 | |
| Concomitant IMM (%) | 14 (46.7) | 12 (40.0) | 15 (50.0) | 17 (56.7) | 0.629 | |
| Concomitant CS (%) | 7 (23.3) | 6 (20.0) | 3 (10.0) | 2 (6.7) | 0.256 | |
| Weigh, median (IQR) (kg) | 73.2 (61.8-80.3) | 73.8 (63.7-82.3) | 76.4 (69.5-89.3) | 79.2 (70.3-90.6) | 0.080 | |
| Baseline BMI, median (IQR), kg/m2 | 21.3 (18.1-25.5) | 22.7 (18.8-25.7) | 24.5 (23.8-27.9) | 26.8 (25.4-30.2) | 0.021 | |
| Albumin, median (IQR), g/L | 4.0 (3.9-4.2) | 4.2 (4.1-4.5) | 4.3 (4.2-4.5) | 4.3 (4.3-4.6) | 0.062 | |
| CRP < 5 mg/L (%) | 18 (60.0) | 22 (73.3) | 27 (90.0) | 28 (93.3) | 0.004 | |
| FC< 100 μg/g | 11 (36.7) | 18 (60.0) | 24 (80.0) | 27 (90.0) | <0.001 | |
| ATI (%) | 7 (23.3) | − | − | − | − | |
| Adalimumab concentration | Q1 (n = 30) | Q2 (n = 31) | Q3 (n = 31) | Q4 (n = 30) | Pa | |
| Male (%) | 17 (56.7) | 16 (51.6) | 16 (51.6) | 18 (60.5) | 0.891 | |
| Age at ADA trough level measurement, median (IQR) (y) | 39.5 (36.9-48.2) | 46.1 (35.13-60.9) | 37.5 (33.2-43.1) | 39.7 (34.7-48.7) | 0.410 | |
| ADA duration, median (IQR) (mo) | 34.8 (17.2-59.8) | 23.4 (13.0-40.0) | 15.7 (7.3-30.1) | 22.0 (9.1-47.7) | 0.864 | |
| Crohn diseaseb (%) | 24 (80.0) | 28 (90.3) | 24 (77.4) | 26 (86.7) | 0.498 | |
| Perianal fistulising CD (%) | 16/24 (66.7) | 14/28 (50.0) | 12/24 (50.0) | 8/26 (31.7) | 0.091 | |
| Previous IBD related surgery (%) | 20 (45.2) | 10 (41.9) | 8 (53.3) | 0.014 | ||
| L1 | 6/24 (25.0) | 11/28 (39.3) | 5/24 (20.8) | 9/26 (34.6) | 0.452 | |
| CD location† (%): | L2 | 2/24 (8.3) | 5/28 (17.9) | 2/24 (8.3) | 2/26 (7.7) | 0.570 |
| L3 | 18/24 (75.0) | 17/28 (60.7) | 15/24 (62.5) | 10/26 (38.5) | 0.065 | |
| B1 | 9/24 (37.5) | 13/28 (46.4) | 14/24 (58.3) | 8/26 (30.8) | 0.229 | |
| CD behavior† (%): | B2 | 6/24 (25.0) | 3/28 (10.7) | 6/24 (25.0) | 6/26 (23.2) | 0.505 |
| B3 | 8/24 (33.3) | 11/28 (39.3) | 7/24 (29.2) | 11/26 (42.3) | 0.769 | |
| E1 | 0/6 (0.0) | 0/3 (0.0) | 0/7 (0.0) | 0/4 (0.0) | − | |
| UC extent‡ (%): | E2 | 4/6 (66.7) | 2/3 (66.7) | 4/7 (57.1) | 2/4 (50.0) | 0.949 |
| E3 | 2/6 (33.3) | 0/3 (0.0) | 3/7 (42.9) | ¾ (75.0) | 0.243 | |
| ADA dose intensification | 10 (33.3) | 18 (58.1) | 16 (51.6) | 16 (51.6) | 0.233 | |
| Concomitant IMM (%) | 5 (16.7) | 10 (32.3) | 20 (64.5) | 20 (66.7) | <0.001 | |
| Concomitant CS (%) | 8 (26.7) | 5 (16.1) | 3 (9.7) | 1 (3.3) | 0.059 | |
| Weigh, median (IQR) (kg) | 80.1 (69.2-89.2) | 77.7 (65.3-84.1) | 74.9 (63.5-82.1) | 72.3 (61.8-79.9) | 0.070 | |
| Baseline BMI, median (IQR), kg/m2 | 28.6 (25.3-30.6) | 27.8 (22.9-31.4) | 23.2 (19.8-27) | 21.2 (19.4-26.8) | 0.004 | |
| Albumin, median (IQR), g/L | 4.1 (3.9-4.5) | 4.2 (4.1-4.4) | 4.2 (4.0-4.5) | 4.3 (4.0-4.6) | 0.073 | |
| CRP < 5 mg/L (%) | 14 (46.7) | 18 (58.0) | 23 (74.2) | 25 (83.3) | 0.013 | |
| FC < 100 μg/g | 9 (30.0) | 18 (58.1) | 20 (64.5) | 25 (83.3) | <0.001 | |
| AAA, (%) | 5 (16.7) | − | − | − | − | |
AAA: antibodies lo adalimumab; ATI: antibodies to infliximab; BMI: body mass index; CD: Crohn's disease; CRP: C-reactive protein; CS: corticosteroids; FC: fecal; IQR: interquartile range; mo: month; IMMs: thiopurines; UC: ulcerative colitis y: years.
The Kruskal-Wallis and the chi-square test were used to compare continuous or discrete variables respectively.
Of the total population receiving anti-TNF therapy, only 7 (6%) on IFX and 5 patients (4%) on ADA developed ATI and ATA, respectively. Titers ranged from 16 to 1,440 ng/mL in IFX and from 12 to 672 in ADA.
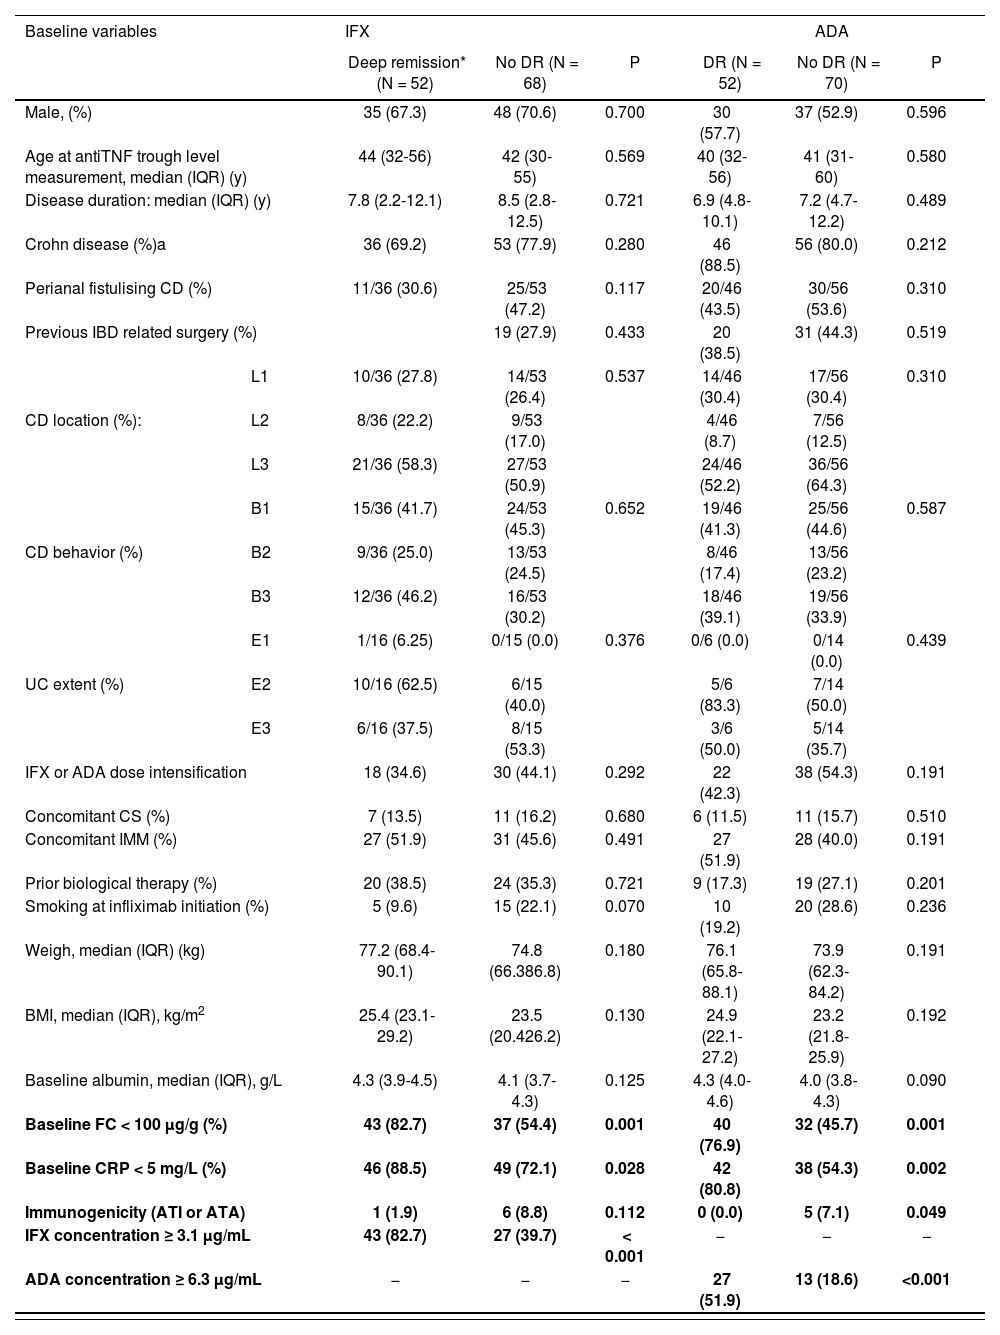
Factors associated with DRUnivariate analysis identified FC < 100 µg/g (P = 0.001), CRP < 5 mg/L (P = 0.028), IFX concentrations ≥ 3.1 µg/mL (P < 0.001) as variables associated with DR in IFX-treated patients. In ADA, the variables associated with DR by univariate analysis were FC < 100 µg/g (P = 0.001), CRP < 5 mg/L (P = 0.002), concentrations ≥ 6.3 µg/mL (P < 0.001) and positive ATA (P = 0.049) (Table 3).
Univariate analysis of baseline variables associated with deep remission
| Baseline variables | IFX | ADA | |||||
|---|---|---|---|---|---|---|---|
| Deep remission* (N = 52) | No DR (N = 68) | P | DR (N = 52) | No DR (N = 70) | P | ||
| Male, (%) | 35 (67.3) | 48 (70.6) | 0.700 | 30 (57.7) | 37 (52.9) | 0.596 | |
| Age at antiTNF trough level measurement, median (IQR) (y) | 44 (32-56) | 42 (30-55) | 0.569 | 40 (32-56) | 41 (31-60) | 0.580 | |
| Disease duration: median (IQR) (y) | 7.8 (2.2-12.1) | 8.5 (2.8-12.5) | 0.721 | 6.9 (4.8-10.1) | 7.2 (4.7-12.2) | 0.489 | |
| Crohn disease (%)a | 36 (69.2) | 53 (77.9) | 0.280 | 46 (88.5) | 56 (80.0) | 0.212 | |
| Perianal fistulising CD (%) | 11/36 (30.6) | 25/53 (47.2) | 0.117 | 20/46 (43.5) | 30/56 (53.6) | 0.310 | |
| Previous IBD related surgery (%) | 19 (27.9) | 0.433 | 20 (38.5) | 31 (44.3) | 0.519 | ||
| L1 | 10/36 (27.8) | 14/53 (26.4) | 0.537 | 14/46 (30.4) | 17/56 (30.4) | 0.310 | |
| CD location (%): | L2 | 8/36 (22.2) | 9/53 (17.0) | 4/46 (8.7) | 7/56 (12.5) | ||
| L3 | 21/36 (58.3) | 27/53 (50.9) | 24/46 (52.2) | 36/56 (64.3) | |||
| B1 | 15/36 (41.7) | 24/53 (45.3) | 0.652 | 19/46 (41.3) | 25/56 (44.6) | 0.587 | |
| CD behavior (%) | B2 | 9/36 (25.0) | 13/53 (24.5) | 8/46 (17.4) | 13/56 (23.2) | ||
| B3 | 12/36 (46.2) | 16/53 (30.2) | 18/46 (39.1) | 19/56 (33.9) | |||
| E1 | 1/16 (6.25) | 0/15 (0.0) | 0.376 | 0/6 (0.0) | 0/14 (0.0) | 0.439 | |
| UC extent (%) | E2 | 10/16 (62.5) | 6/15 (40.0) | 5/6 (83.3) | 7/14 (50.0) | ||
| E3 | 6/16 (37.5) | 8/15 (53.3) | 3/6 (50.0) | 5/14 (35.7) | |||
| IFX or ADA dose intensification | 18 (34.6) | 30 (44.1) | 0.292 | 22 (42.3) | 38 (54.3) | 0.191 | |
| Concomitant CS (%) | 7 (13.5) | 11 (16.2) | 0.680 | 6 (11.5) | 11 (15.7) | 0.510 | |
| Concomitant IMM (%) | 27 (51.9) | 31 (45.6) | 0.491 | 27 (51.9) | 28 (40.0) | 0.191 | |
| Prior biological therapy (%) | 20 (38.5) | 24 (35.3) | 0.721 | 9 (17.3) | 19 (27.1) | 0.201 | |
| Smoking at infliximab initiation (%) | 5 (9.6) | 15 (22.1) | 0.070 | 10 (19.2) | 20 (28.6) | 0.236 | |
| Weigh, median (IQR) (kg) | 77.2 (68.4-90.1) | 74.8 (66.386.8) | 0.180 | 76.1 (65.8-88.1) | 73.9 (62.3-84.2) | 0.191 | |
| BMI, median (IQR), kg/m2 | 25.4 (23.1-29.2) | 23.5 (20.426.2) | 0.130 | 24.9 (22.1-27.2) | 23.2 (21.8-25.9) | 0.192 | |
| Baseline albumin, median (IQR), g/L | 4.3 (3.9-4.5) | 4.1 (3.7-4.3) | 0.125 | 4.3 (4.0-4.6) | 4.0 (3.8-4.3) | 0.090 | |
| Baseline FC < 100 μg/g (%) | 43 (82.7) | 37 (54.4) | 0.001 | 40 (76.9) | 32 (45.7) | 0.001 | |
| Baseline CRP < 5 mg/L (%) | 46 (88.5) | 49 (72.1) | 0.028 | 42 (80.8) | 38 (54.3) | 0.002 | |
| Immunogenicity (ATI or ATA) | 1 (1.9) | 6 (8.8) | 0.112 | 0 (0.0) | 5 (7.1) | 0.049 | |
| IFX concentration ≥ 3.1 μg/mL | 43 (82.7) | 27 (39.7) | < 0.001 | − | − | − | |
| ADA concentration ≥ 6.3 μg/mL | − | − | − | 27 (51.9) | 13 (18.6) | <0.001 | |
AAA: antibodies to adalimumab; ATI: antibodies to infliximab; BMI: body mass index; CRP: C-reactive protein; CS: corticosteroids; DR: deep remission; FC: fecal; IQR: interquartile range; mo: month; IMMs: thiopurines; y: years.
aPercentage of Crohn's disease versus ulcerative colitis.
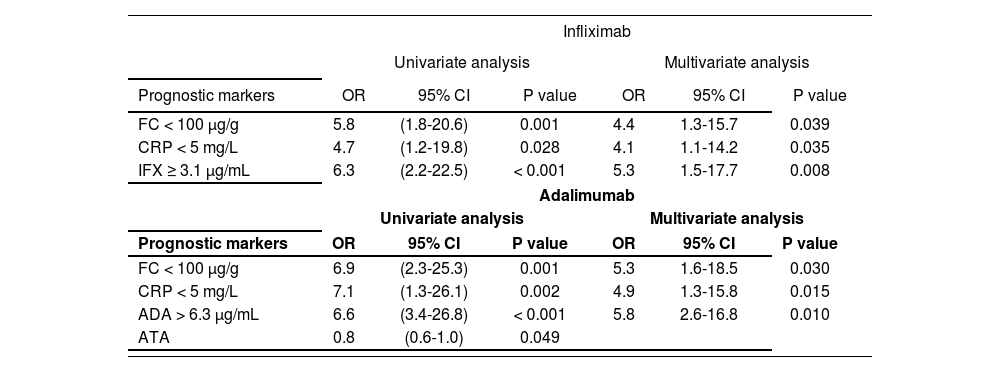
Multivariate binary logistic regression analysis retained FC < 100 µg/g (P = 0.039), CRP < 5 mg/L (P = 0.035), IFX concentrations ≥ 3.1 µg/mL (P = 0.008) in IFX, and FC < 100 µg/g (P = 0.030), CRP < 5 mg/L (P = 0.015) and ADA concentrations ≥ 6.3 µg/mL (P = 0.010) in ADA associated with DR (Table 4).
Variables associated with deep remission
| Infliximab | ||||||
|---|---|---|---|---|---|---|
| Univariate analysis | Multivariate analysis | |||||
| Prognostic markers | OR | 95% CI | P value | OR | 95% CI | P value |
| FC < 100 μg/g | 5.8 | (1.8-20.6) | 0.001 | 4.4 | 1.3-15.7 | 0.039 |
| CRP < 5 mg/L | 4.7 | (1.2-19.8) | 0.028 | 4.1 | 1.1-14.2 | 0.035 |
| IFX ≥ 3.1 μg/mL | 6.3 | (2.2-22.5) | < 0.001 | 5.3 | 1.5-17.7 | 0.008 |
| Adalimumab | ||||||
| Univariate analysis | Multivariate analysis | |||||
| Prognostic markers | OR | 95% CI | P value | OR | 95% CI | P value |
| FC < 100 μg/g | 6.9 | (2.3-25.3) | 0.001 | 5.3 | 1.6-18.5 | 0.030 |
| CRP < 5 mg/L | 7.1 | (1.3-26.1) | 0.002 | 4.9 | 1.3-15.8 | 0.015 |
| ADA > 6.3 μg/mL | 6.6 | (3.4-26.8) | < 0.001 | 5.8 | 2.6-16.8 | 0.010 |
| ATA | 0.8 | (0.6-1.0) | 0.049 | |||
ATA: antibodies anti adalimumab; CI: confidence intervals; CRP: C-reaclive protein; FC: fecal calprotectin; OR: odds ratio.
A multivariate binary logistic was performed including variables from univariate analysis with a P value < 0.1, following Backward Wald method to identify the independent variables associated with DR.
A treat-to-target approach leading to better clinical outcomes as a new therapeutic strategy. This study demonstrated that higher IFX and ADA concentrations during maintenance therapy are associated with DR in IBD.
TDM of anti-TNF agents has been associated with biomarker normalization and clinical remission. In a cohort based on a study of 1,487 samples from 483 patients, it was shown that an IFX concentration of > 2.79 µg/mL was associated with CRP < 5 mg/L12. A meta-analysis13, which included 22 studies, a higher minimum serum IFX concentration was associated with clinical remission, and an IFX cutoff concentration above 2 µg/mL was associated with an increased likelihood of clinical remission. Similarly, a major ADA concentrations were associated with improved clinical outcomes. The meta-analysis14 that included seven observational studies, a systematic review, a meta-analysis, and a clinical trial post hoc analysis, suggested ranges of ADA concentrations vary by target, postulating concentrations of 4.8 µg/mL as the cutoff point for clinical remission.
In our study, univariate and multivariate logistic regression analysis shows a strong correlation between IFX and ADA concentrations and DR. Importantly, an optimal cutoff value of 3.1 µg/mL for IFX and 6.3 µg/mL for ADA trough concentrations were identified. The cutoff point related to DR was lower than that observed in others studies15-18 which propose a therapeutic window of 5-10 µg/mL for IFX and 8-12 µg/mL for ADA to achieve MH. However, the trough concentrations in these studies were not obtained at steady state, which could explain the higher therapeutic range proposed. In this respect, cutoff values in the literature are very heterogeneous and other studies proposed values of 3.4 µg/mL19 for IFX and 4.9 µg/mL for ADA20. In this study, a huge percentage of patients with previous IBD surgery were included, and no differences in DR were observed, despite having lower anti-TNF concentrations. Anti-TNFs have shown high efficacy in preventing postoperative endoscopic recurrence of CD21, Sorrentino et al.22 suggested that lower doses of IFX, despite obtaining lower concentrations, maintained clinical and endoscopic remission in this patient profile. Although our study identified a specific cutoff point associated with DR, the range of concentrations associated with deep remission was wide, ranging from 0 to 14.4 µg/mL and from 2.36 to 15.6 µg/mL in IFX and ADA, respectively, so the target concentration should be individualized. Infliximab level up to 3.1 µg/mL resulted in an increased DR rate, and higher drug levels were not associated with a much greater increase in DR. In the case of ADA, major levels (>12 µg/mL) lead to improve DR proportion, so some patients may require even higher concentrations to achieve better results. In this regard, Plevris et al.23, explain that higher concentrations of ADA are necessary for fistula closure. However, in our study, only 6 patients achieved these concentrations, so no conclusions can be drawn.
Similarly, to the available evidence, CRP < 5 mg/L24 and FC < 100 µg/g25 were identified as independent factors of DR. In addition, high BMI, absence of previous IBD-related surgery, CRP < 5 mg/L, FC < 100 µg/g in IFX, and coadministration of IMMs, low BMI, absence of previous IBD-related surgery, CRP < 5 mg/L, and FC < 100 µg/g in ADA positively influence to achieve higher trough concentrations. The influence of BMI was in agreement with other studies, in a pharmacokinetic study26 of 24 patients receiving IFX, higher BMI correlated with higher post-infusion concentrations; although this did not correlate with a higher response rate, suggesting that circulating concentrations of the drug did not correlate with tissue concentrations. In the case of ADA, in a prospective pharmacokinetic study of Sanchez et al., BMI showed influence by increasing the apparent clearance of ADA, and was a significant variable in the pharmacokinetics of ADA27.
In contrast to other studies28, concomitant immunomodulators did not correlate with IFX concentrations in our study. However, in a multicenter retrospective study29 withdrawal of immunomodulators after at least 6 months of concomitant treatment with IFX did not reduce minimal IFX concentrations in patients with CD. In this regard, the patients included in our study had a median IFX treatment duration of 10.9 months, and could influence the lack of impact of immunomodulator coadministration on IFX concentrations. Coadministration of IMMs was associated with higher ADA concentrations in our series of patients, similar to a Diamond trial30, which evaluated the efficacy of ADA with and without azathioprine in CD patients, although not statistically significant (p 0.084), coadministration of IMMs tended to a higher minimum ADA concentration.
Immunogenicity was numerically higher in IFX than in ADA, as only 7 (6%) in IFX and 5 patients (4%) in ADA developed antibodies to the drug. However, the percentage of immunogenicity observed in the literature is very heterogeneous and can fluctuate depending on the immunoassay method used, varying widely between 0% and 79% in IFX and 0% and 87% in ADA, according to a recent review31. Positive ATI and ATA have been associated with a loss of clinical response32,33. In our study, ATA was negatively related to DR in univariate analysis, although it was not significant in multivariate analysis. Furthermore, only 1 of the 7 IBD patients with ATI, and no patients with ATA were in DR.
The use of a drug-sensitive assay that only detects concentrations of free TNF-α inhibitors and free anti-drug antibodies, with an inability to measure anti-drug antibodies in the presence of TNF-α inhibitors, could influence the low prevalence of patients with positive immunogenicity. Drug-tolerant assays from other manufacturers11 use an acidic buffer that dissociates immunocomplexes between anti-drug antibodies and ADA or IFX, allowing measurement of anti-drug antibodies that are part of these immunocomplexes. TDM using these kits could improve the sensitivity of immunogenicity detection, improving the analysis of the influence of drug antibodies on DR. However, in a post hoc analysis of the TAXIT34 trial that analyzed the clinical relevance of ATIs measured by a drug tolerance assay, it concluded that only high concentration ATIs, which are usually also detected in a drug sensitivity assay, persist over time and are clinically relevant and drug switching may be more cost-effective.
The main strength of our study was the systematic evaluation of DR considered as the new therapeutic target, using biomarkers and clinical and endoscopic scales. Unlike other studies, which evaluated the impact of IFX or ADA TDM using only biomarkers, or clinical and endoscopic assessment without standardization. Importantly, we were able to identify an optimal cutoff value for minimal IFX and ADA concentrations.
Our study has several weaknesses that should be mentioned. It is a single-center, real-world retrospective study, so confounders cannot be definitively excluded. No centralized reading of endoscopies was performed and interobserver variability cannot be excluded. Sampling was performed at different times in the course of the disease and a high percentage of patients with an intensification regimen were included. This may lead to an underestimation of the cut-off points, since concentrations that, due to a poor response, implied an intensification of treatment were not evaluated. In addition, clinical outcomes, such as hospitalization or colectomy, are not analyzed. The mean albumin level, a biomarker of anti-TNF clearance and enteropathy, was normal (4 g/L) in our cohort, and was not shown to be a factor associated with plasma concentrations or deep remission.
In conclusion, our findings highlight that IFX and ADA trough concentrations, CRP < 5 mg/L and FC < 100 µg/g are associated significantly with DR during maintenance therapy. Noteworthy, an optimal cut-off of 3.1 for IFX and 6.3 µg/mL for ADA were identified for predicting this outcome.
FundingNo funding.
Conflict of interestNo conflict of interest.
Contribution to the scientific literature
Deep remission, defined as clinical remission accompanied by healing of the intestinal mucosa, has emerged as a new therapeutic endpoint in the management of inflammatory bowel disease. Several studies have evaluated the impact of therapeutic monitoring of infliximab and adalimumab on the treatment of inflammatory bowel disease. However, most authors measure the response to these anti-TNF drugs using surrogate variables such as analytical biomarkers, non-standardized physician evaluations, or clinical remission scales. In contrast, this paper evaluated the association of serum concentrations of infliximab and adalimumab with the achievement of deep remission as a clinical endpoint during maintenance therapy.
The study contributes evidence on the clinical significance of the concentration of these anti-TNF drugs for the achievement of deep remission. It demonstrates the added value inherent in monitoring anti-TNF concentrations in hospital pharmacy departments. At the same time, it supports the active involvement of hospital pharmacists in the decisions about these drugs when used in the context of inflammatory bowel disease.
Early Access date (08/18/2021).

