


The first targeted therapy in oncology, imatinib, revolutionized chronic myeloid leukemia (CML) treatment and spurred research in targeted therapies for various cancers. CML results from a chromosomal translocation, forming the BCR-ABL1 fusion gene. Asciminib has been recently approved for third-line refractory or intolerant patients. Treatment-free remission (TFR) is attainable with sustained deep molecular response (DMR) and this approach could be incorporated into pharmacoeconomic models.
AimsTo establish a cost-effectiveness model comparing asciminib to approved third-generation tyrosine kinase inhibitors (TKIs) (bosutinib and ponatinib) with a focus on achieving TFR. Additionally, the budgetary impact of incorporating asciminib as a therapeutic alternative is assessed.
MethodsThis model is based on a Markov chain with 7 states. The condition for achieving TFR is to remain for 5 years in DMR state. Efficacy of the model was measured in QALYs, and the costs included in the base case analysis are based in Spain. A probabilistic (PSA) and deterministic analysis (DSA) were carried out to assess the variability of the model. There were achieved 2 independent models comparing asciminib vs bosutinib and asciminib vs ponatinib.
ResultsAsciminib, when compared with ponatinib, is a cost-saving alternative, as efficacy is similar between alternatives, and asciminib have a lower cost of 30,275€. Asciminib showed 4.33 more QALYs and a higher cost (203,591€) than bosutinib, resulting in an ICER of €47,010.49 per QALY. PSA shows that the parameters with higher influence in the variability of the model were the probability of transitioning to BP and probabilities of achieving MMR and DMR. A one-way analysis reports that the drug cost has a higher influence on both models, and the discount rate significantly affects the asciminib vs bosutinib model.
ConclusionAsciminib broadens therapeutic choices for patient’s refractory or intolerant to 2 prior lines of treatment in a cost-effectiveness manner. The costs of drugs significantly impact the overall cost of the disease, emphasizing the importance of the selected discount rates for each drug. Given the relatively low incidence of CML, the introduction of asciminib has a limited budgetary impact, warranting individualized decisions based on patient`s clinical characteristics.
La primera terapia dirigida en oncología, el imatinib, revolucionó el tratamiento de la leucemia mieloide crónica (LMC) e impulsó la investigación de terapias dirigidas para diversos tipos de cáncer. La LMC es el resultado de una translocación cromosómica que forma el gen de fusión BCR-ABL1. Asciminib ha sido aprobado recientemente para pacientes de 3.ª línea refractarios o intolerantes. La remisión sin tratamiento es alcanzable con una respuesta molecular profunda (DMR) sostenida y este enfoque podría incorporarse a los modelos farmacoeconómicos.
ObjetivosEstablecer un modelo de coste-eficacia que compare asciminib con los TKI de tercera generación aprobados (bosutinib y ponatinib) centrándose en la consecución de la remisión libre de tratamiento (TFR). Además, se evalúa el impacto presupuestario de la incorporación de asciminib como alternativa terapéutica.
MétodosEste modelo se basa en una cadena de Markov con 7 estados. La condición para alcanzar la TFR es permanecer durante 5 años en el estado DMR. La eficacia del modelo se midió en AVAC y los costes incluidos en el análisis del caso base se basan en España. Se realizó un análisis probabilístico (PSA) y determinístico (DSA) para evaluar la variabilidad del modelo. Se evaluaron 2 modelos independientes comparando asciminib frente a bosutinib y asciminib frente a ponatinib.
ResultadosAsciminib, en comparación con ponatinib, es una alternativa que ahorra costes, ya que la eficacia es similar entre las alternativas, y asciminib tiene un coste inferior de 30.275€. Asciminib mostró 4.33 AVAC más y un mayor coste (203.591€) que bosutinib, resultando en una RCEI de 47.010,49€ por AVAC. El PSA muestra que los parámetros con mayor influencia en la variabilidad del modelo fueron la probabilidad de transición a fase acelerada y las probabilidades de alcanzar MMR y DMR. El análisis determinístico informa de que el coste del fármaco tiene una gran influencia en ambos modelos, y la tasa de descuento afecta significativamente al modelo de asciminib frente a bosutinib.
ConclusionesAsciminib amplía las opciones terapéuticas para pacientes refractarios o intolerantes a 2 líneas previas de tratamiento de forma coste-efectiva. Los costes de los fármacos repercuten significativamente en el coste global de la enfermedad, lo que subraya la importancia de las tasas de descuento seleccionadas para cada fármaco. Dada la incidencia relativamente baja de la LMC, la introducción de asciminib tiene un impacto presupuestario limitado, lo que justifica decisiones individualizadas basadas en las características clínicas de los pacientes.
Chronic myeloid leukemia (CML) is the most common myeloproliferative disorder, accounting for 15%–20% of all leukemia cases. The annual estimated incidence is 1–1.5 cases per 100,000 with a prevalence of about 1 in 17,000. The disease is typically triphasic, with a chronic phase, an accelerated phase (AP), and a blast phase (BP). Most patients are diagnosed in the chronic phase and may remain asymptomatic with appropriate treatment.1
The first targeted therapy developed in oncology was imatinib for CML. This treatment changed the prognosis of patients and served as a catalyst for further research into targeted therapies for other types of cancer. Before the approval of imatinib, the treatment for CML consisted of cytotoxic drugs that affected DNA structure and synthesis, leading to multiple toxicities. CML is caused by a reciprocal translocation between the chromosomes 9 and 22 t(9;22) (q34;q11.2), resulting in a formation of a chimeric fusion gene known as BCR-ABL1. Depending on the location of breakpoint within the BCR gene, various chimeric genes are formed encoding different proteins. The most frequent observed proteins are p210 and p190.2 The prognosis of patients with CML improved after imatinib irruption. Furthermore, the criteria for assessing treatment efficacy were subsequently revised. Before the arrival of imatinib the primary outcome for assessment the efficacy was the overall survival (OS). Due to a remarkable efficacy of imatinib in terms of OS, alternative outcomes based on cytogenetic response (CR) and molecular response (MR) were employed for assessing efficacy.3,4 Second-generation tyrosine kinase inhibitors (TKIs) have been shown faster and deeper molecular response when compared with imatinib. However, there were no significance difference in OS between the treatment groups. Second-generation TKIs are suitable options for patients with a high Sokal risk score at the time of diagnosis, whereas imatinib remains a suitable choice for first-line treatment in patients with low Sokal score. The choice among these drugs is determinated by the adverse reaction profile of each drug and the patient's comorbidities. Currently, treatment options include third-generation TKIs such as ponatinib and bosutinib, which should be reserved for patients who do not respond to or are intolerant to first- and second-generation TKIs.
The target of all these drugs is the active site of the tyrosine kinase, inhibiting it through competitive mechanisms, which have 2 main consequences: (1) In vitro activity of these drugs does not affect to stem cell. Clinically, this fact results in relapse if treatment is discontinued. However, there is evidence reporting that treatment-free remission (TFR) can be achieved in patients who maintain deep molecular response (DMR) over time.5 Achieving TFR involves maintaining undetectable BCR-ABL copies without any treatment. In other words, in this state, cure of the disease is achieved. There is controversy regarding the optimal time after reaching DMR before attempting treatment discontinuation. It is proposed between 2 and 5 years.6 (2) The lack of selectivity between TKIs due to the conserved center site of these proteins. Differences in the adverse events (AEs) were observed depending on the TK inhibition profile of each drug.
Recently, asciminib have been approved by European Medicines Agency. Asciminib does not inhibit the center site of the tyrosine kinase. Instead, asciminib binds to an allosteric site on BCR-ABL1, inducing a conformational change that leads to its inhibition. The innovative mechanism of action of asciminib has positioned it as an alternative for refractory or intolerant patients who have not responded to other treatments. The ASCEMBL trial is a randomized, controlled, and open trial that compares asciminib vs bosutinib in refractory or intolerant patients who have undergone 2 or more lines of treatment. However, patients with T315I or V299L mutations were excluded.7 In this study DMR rates, at week 96, were 10.8% for asciminib and 5.3% for bosutinib. Currently, there is no study comparing asciminib vs ponatinib directly. However, data from a matching-adjusted indirect comparison (MAIC) reported that asciminib reach higher rates of MMR than ponatinib with a relative risk of 1.55 at 6 months.8
There is no doubt regarding the therapeutic and social value added by these drugs, attributable to their efficacy in terms of OS and his well-tolerated AE profile. Expanding treatment options is important to achieve improved outcomes in third or subsequent lines of treatment. Furthermore, it is feasible to attain TFR in patients who achieve DMR over a prudent period of time, including those who have undergone third-line treatment. TFR represent the most efficient state of health, as its cost is the lowest, and the quality of life is free from adverse drugs events and complications associated with CML.
The objective of this study is to establish a model that evaluates the cost-effectiveness ratio of asciminib compared to approved third-generation TKIs (bosutinib and ponatinib). We adopt the TFR approach as it represents the optimal health state, free from both disease and treatment-derived AEs.
In addition, we assess the budgetary impact of including asciminib as a therapeutic alternative.
MethodsEfficacy measurementIn the management of CML, 3 outcomes are commonly used: hematologic response (HR), CR, and MR. A complete HR is defined as normalization of the peripheral blood leukocyte count, absence of immature granulocytes, and absence of extramedullary disease. CR is assessed by observing metaphases in the karyotype or through fluorescence in situ hybridization (FISH) to measure the number of chromosomes with the BCR-ABL1 mutation. MR measures the number of BCR-ABL1 gene transcripts by PCR. To standardize the MR measurement, the international scale (IS) is used. DMR criteria may vary by source, but generally, a MR greater than RM4.5 is accepted, indicating that transcripts are considered undetectable. HR and CR are useful in the early stages of CML or in non-responder patients. However, when patients respond well to treatment, the most valuable parameter for follow-up is MR. MR is the most appropriate in the long term as patients with adequate MR will generally maintain good HR and CR. Indeed, HR and CR are rarely used to monitor the response to TKIs.9 CR requires a bone marrow blood sample, whereas the MR can be measured in peripheral blood. Furthermore, the criterion used for selecting patients who are candidates for TFR is the duration of their maintenance of a DMR. DMR is defined as achieving an MR4.5. In conclusion, HR and CR may be suitable for acute illnesses, but the most appropriate parameter to include in a model whit a longer time horizon is MR.
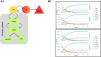
Model definitionThe pharmacoeconomic model is based on a Markov chain with 7 states: (Major Molecular Response (MMR), Deep Molecular Response (DMR), Treatment-Free Remission (TFR), Non-Treatment-Free Remission (NOTFR), Accelerated Phase (AP), Blast Phase (BP), and DEATH (Fig. 1A). TFR and NOTFR states are absorbing states simulating patients who achieve DMR. The difference between TFR and NOTFR is that patients in TFR state are free of treatment, while patients in NOTFR state need to maintain treatment for achieving DMR. The condition for achieving TFR or NOTFR is to remain for 5 Markov cycles in DMR state. This implies that patients must maintain DMR for 5 years on treatment. When this condition is reached, an attempt can be made to withdraw treatment and achieve TFR or NOTFR. The NOTFR condition is similar to DMR but is absorptive and we considered that by reestablishing treatment a correct response will be achieved.

(A) Markov model reflecting the 7 health states. Arrows show the transitions possibilities within the model. (B) Flow of patients through the model in the base case. MMR: Major Molecular Response, DMR: Deep Molecular Response, TFR: Treatment-Free Remission, NOTFR: Non-Treatment-Free Remission, AP: Accelerated Phase, BP: Blast Phase.
Time horizon considered was 30 years. This is an approximation based on the relatively long-life expectancy in these patients, approximately around 80 years, which is comparable to the general population. The average age of diagnosis is over 50 years.10 Duration of each Markov cycle is 1 year. Treatment efficacy is measured in quality-adjusted life years (QALYs). The probabilities of transitioning between health states and the utilities used for calculating QALYs are shown in Table 1. The probability of achieving TFR or NOTFR was 50% for each alternative. The probability of progressing to BP and experiencing death was consistent across all alternatives, as discontinuation of drugs was required upon relapse in AP. The probability of relapsing to AP was calculated as the complementary to unity (in transition matrix) of patients not reaching MMR and DMR for each alternative. Probability of achieving MMR in the ponatinib model was calculated by using a relative risk.11 The model adopts the perspective of the healthcare provider. The discount rate in base case was 2.5%. The costs included in the base case of the model encompass drug acquisition costs and healthcare expenses for patients in each state of health,12 as detailed in Table 2. The cost of asciminib was extrapolated from NICE appraisal.13 The corresponding exchange rate was applied since the prices and costs are expressed in euros (Table 3). The currency exchange rated used was 1€=1.1678£ (August, 2023). The budget impact was calculated by following the GENESIS guideline.14 Two independent models were employed to assess the 2 primary therapeutic alternatives for asciminib: bosutinib and ponatinib. The model is based in Spain, as the costs included in the base case analysis are derived from this country.
Transition probabilities between states and utilities associated to each state. Each probability represents the response rate from the previous state as represented by the model illustrated in Fig. 1 (i.e., the MMR rate represents the percentage of patients achieving MMR after initiating treatment). The probabilities represented in this table are those used to construct the transition matrix of the Markov model. The last 4 rows are common for 3 alternatives. CP: Chronic Phase, MMR: Molecular Mayor Response, DMR: Deep Molecular Response, TFR: Treatment-Free Remission, NOTFR: No Treatment-Free Remission, AP: Accelerated Phase, BP: Blast Phase.
| Drug | Transition | Probability (%) | Ref | Utility | Ref |
|---|---|---|---|---|---|
| Basal CP | – | – | 0.89 | (Szabo et al. 2010)12 | |
| Asciminib | MMR | 37.6 | (Andreas Hochhaus et al. 2023)5 | 0.713 | (Réa et al. 2023)13 |
| DMR | 10.7 | ||||
| NOTFR | 50 | (Shih, Cortes, and Kantarjian 2019)11 | |||
| Bosutinib | MMR | 15.8 | (Andreas Hochhaus et al. 2023)5 | 0.742 | (Réa et al. 2023)13 |
| DMR | 5.3 | ||||
| NOTFR | 50 | (Shih, Cortes, and Kantarjian 2019)11 | |||
| Ponatinib | MMR | p_MMR_A*rra | (Atallah et al. 2023)9 | 0.84 | cCalculated |
| DMR | 24 | (Cortes et al. 2018)10 | |||
| NOTFR | 50 | (Shih, Cortes, and Kantarjian 2019)11 | |||
| Common states | TFR | 50 | (Shih, Cortes, and Kantarjian 2019)11 | 1 | Assumption |
| AP | Cb | - | 0.406 | (Pandor et al. 2018)6 | |
| BP | 41 | (Gambacorti-Passerini et al. 2015)14 | 0.166 | ||
| DEATH | 77 | (Gambacorti-Passerini et al. 2015)14 | 0 | Assumption | |
Frequency of events and unitary cost associated with each health state. CP: Chronic Phase, MMR: Molecular Mayor Response, DMR: Deep Molecular Response, TFR: Treatment-Free Remission, NOTFR: No Treatment-Free Remission, AP: Accelerated Phase, BP: Blast Phase, PCR: Polymerase Chain Reaction.
| Annual frequency | ||||||||
|---|---|---|---|---|---|---|---|---|
| MMR | DMR | TFR | NOTFR | AP | BP | DEATH | Unitary cost (€) | |
| Specialist visit | 3 | 2 | 1 | 2 | 6 | 6 | 0 | 56.98 |
| PCR | 3 | 2 | 1 | 2 | 6 | 6 | 0 | 260.03 |
| Cytogenetic test | 1 | 0 | 0 | 0 | 2 | 2 | 0 | 154.46 |
| Hospitalization | 0 | 0 | 0 | 0 | 0 | 1 | 0 | 9594 |
Population included in asciminib vs bosutinib model was extracted from the ASCEMBL trial7 (NCT03106779). In ASCEMBL, patients in the chronic phase who had previously received 2 or more lines of treatment, including both intolerant and refractory patients, were included. Patients with complete cytogenetic response (CCR) were also part of the study population. At screening, BCR-ABL1 transcript levels on the IS must have been ≥1%. Patients in chronic phase at screening who had progressed at any time previously to AP or BP were excluded. Patients with known BCR-ABL1 mutations of T315I or V299L and patients with cardiac disorders or repolarization abnormalities, were also excluded.
In the model comparing asciminib vs ponatinib, the target population corresponds with population from MAIC8 between ASCEMBL and PACE15 (NCT01207440). MAIC is a statistical methodology used to compare treatments in the absence of direct comparative data. It involves selecting clinical studies, identifying baseline characteristics of patients, and adjusting them to create comparable treatment groups. Propensity score matching is a common technique employed for this purpose. After adjusting for baseline characteristics, a comparative analysis is conducted to assess the relative effectiveness or safety of treatments. While MAIC has limitations, it can offer valuable insights when direct evidence from controlled and randomized clinical trials is lacking.
In this MAIC,8 patients with CCR were excluded from ASCEMBL cohort, as they were also excluded in the PACE trial. Patients intolerant or refractory to dasatinib or nilotinib were enrolled in the PACE study, but not necessary in third-line therapy. In addition, patients with the T351I mutation were included. These differences between the PACE and ASCEMBLE populations were not addressed in the MAIC. However, we consider the populations to be similar in terms of patients being refractory or intolerant to second-generation TKIs.
Sensitivity analysisProbabilistic sensitivity analysis (PSA) was conducted involving 1,000 simulations to assess the model`s uncertainty. Costs associated with drugs treatments, hospitalization, AP, and BP were included in the analysis, employing a gamma distribution. Probability of achieving MMR and DMR, as well as the risk of relapsing to AP were modelled using a multinomial distribution. Transition probabilities from AP to BP and BP to DEATH were modeled using a beta distribution. In asciminib vs ponatinib model, relative risk was modeled using a normal distribution to define the probability of achieving MMR. All other parameters were modeled in the same manner as in the asciminib vs bosutinib model.
The gamma distribution is useful for modeling positive continuous variables such as costs. The multinomial distribution was used to model the probability between multilevel categorical variables. The beta distribution models continuous variables defined in the interval [0–1]. For this reason, it was used to model the probability of transitions from AP to BP and from BP to DEATH. The probability of achieving MMR in the ponatinib model was estimated using the relative risk extracted from Atallah et al.8 This probability was modeled as a normal variable centered on the given relative risk value.
To assess the impact of the parameters in the model, a deterministic sensitivity analysis was carried out. The analyzed parameters included in analysis were costs of drug treatment (range 90%–110%), discount rate (range 0%–6%), cost of BP (range 50%–150% with respect the base case) and transition probabilities (Supplementary appendix). The analysis was conducted using the package Heemod within the R software (version 4.3.1) and RStudio 2023.06.0 © 2009-2023 Posit Software, PBC.
ResultsBase caseThe asciminib vs bosutinib model reported a QALY difference of 4.33 in favor of asciminib. Furthermore, asciminib was associated with higher cost compared to bosutinib, resulting in an incremental cost-effectiveness ratio (ICER) of €47,010.49 per QALY for asciminib alternative. In the asciminib vs ponatinib model, the difference in efficacy between the alternatives was minimal, with an 0.17 QALYs advantage in favor of ponatinib. Asciminib had a lower cost compared to ponatinib, resulting in a difference in cost of €30,275.4. These results indicate that while asciminib is slightly less effective, is also less costly than ponatinib, resulting in an ICER of €175,135.6 per QALY. The model outcomes are significantly influenced by difference in the duration and depth of MR, as these factors can impact OS and the likelihood of patients achieving TFR. Fig. 1B illustrates the flow of patients through the model.
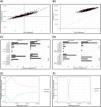
Probabilistic sensitivity analysisThe asciminib vs bosutinib model demonstrates significant robustness, as evidenced by the fact that every simulation falls within the first quadrant of the cost-effectiveness plane in the Cartesian coordinate system (Fig. 2B). The ICER calculated in the PSA remained similar to the base case, with an ICER of €46,958.90 per QALY. These findings indicate a high level of internal validity. The parameters with the greatest impact on the variability of the model were the probability of achieving DMR and the probability of relapsing to the AP. Additionally, the cost of asciminib had a significant influence on the model's variability.

(A) PSA of asciminib vs ponatinib model. (B) PSA of asciminib vs bosutinib model. The black dashed line represents the 95%CI. The red line indicates the threshold of 25,000€ per QALY. (C) Impact of parameters included in PSA to the asciminib vs ponatinib model. (D) Impact of parameters included in PSA to the asciminib vs bosutinib model. (E) Scenario analysis depending on the willingness to pay variation in the asciminib vs ponatinib model. (F) Scenario analysis depending on the willingness to pay variation in the asciminib vs bosutinib model. p_AA_A: probability to achieve MMR (asciminib), p_AA_B: probability to achieve MMR (ponatinib in C and bosutinib in D), p_AB_A: probability to transitioning from MMR to DMR (asciminib), p_AB_B: probability to transitioning from MMR to DMR (ponatinib in C and bosutinib in D), p_AE_A: probability of transitioning from MMR to AP (asciminib), p_AE_B: probability of transitioning from MMR to AP (ponatinib in C and bosutinib in D), p_EF: probability of transitioning from AP to BP, p_FG: probability of transitioning from BP to DEATH, rr: relative risk, WTP: willingness to pay.
The variability in the asciminib vs ponatinib model was greater than that observed in the asciminib vs bosutinib model (Fig. 2A). The similarity in efficacy outcomes in the base case renders the model more sensitive to variations in efficacy affecting in global outcomes of the model. The probability of transitioning to the AP had the most significant impact on the variability of the model. Variations in the relative risk also exerted a substantial influence. Therefore, if the relative risk changes, the probability of achieving MMR will also be affected. The third factor contributing to the variability of the model was the probability of achieving DMR (Fig. 2C and D). In the alternative scenario analysis, asciminib was found to be slightly more effective than ponatinib, which differs from the base case. The difference was 0.13 QALYs in favor of asciminib. Additionally, the cost of asciminib was found to be lower than ponatinib, rendering asciminib a more cost-effective alternative than ponatinib, as indicated by the scenario analysis, which considered a different range of willingness to pay (Fig. 2E). Furthermore, the analysis shows the significance of defining transition probability to AP to reduce the uncertainty of the model. The likelihood of asciminib being a cost-effective alternative is higher as willingness to pay increases, compared to bosutinib (Fig. 2F).
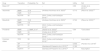
Deterministic sensitivity analysisA one-way sensitivity analysis was carried out to assess the influence of each parameter in the model. Costs of drugs had a significant influence in the model as reflect the tornado diagram (Fig. 3). The diagram illustrates how a variation in cost drugs of 10% (ranging from 0.9 to 1.1 times of the base case) affects the outcomes. In the bosutinib model, applying a 10% discount to asciminib results in an ICER below €40,000 per QALY. Discount rate had a greater influence in the bosutinib model compared to the ponatinib model. Hence, the larger the difference between MMR and DMR rates, the greater the influence of discount rate in the model over time. Variations in costs of BP had a minor effect on the model, which is noteworthy because this health state is associated with the highest costs compared with other health states in the model, primarily derived from the healthcare expenses (excluding drug costs). The utility of ponatinib was tested in one-way sensitivity analysis since the value included in the base case was an assumption, given the absence of studies evaluating the quality of life in patients receiving ponatinib. An arbitrary value ponatinib`s utility was tested. When a utility value of 0.7 points was assigned to ponatinib, it resulted in differences in efficacy of up to 0.98 in favor of asciminib.

One-way analysis in: (A) asciminib vs ponatinib model and (B) asciminib vs bosutinib model. The X-axis represents the variation in the ICER. The tornado is centered on the ICER value of the base case of each model. dr: discount rate, p_EF: probability of transitioning from accelerated phase to blast phase, p_FG: probability of transitioning from blast phase to death; dr_bosutinib: discount rate applied for bosutinib cost (range 0.9–1.1); dr_ponatinib: discount rate applied for ponatinib cost (range 0.9–1.1).
This Markov model represents an alternative to other partitioned survival-based pharmacoeconomic models. Partitioned survival models require the use of surrogate parameters to estimate OS, primarily because there is a lack of OS data due to the relatively short follow-up periods in certain cohorts (e.g., asciminib). One such parameter recently employed is time to treatment discontinuation (TTD). Hence, this model relies on empirical data and does not require the use of subrogate parameters to estimate model efficacy, which constitutes a notable strength of this model. Moreover, modeling the approach of TFR is of particular interest because of the efficacy of new treatments, which are associated with relatively high DMR rates. Hence, it is relevant to incorporate the TFR approach into pharmacoeconomic models since this health state is devoid of drug costs. The TFR approach has been incorporated into previous pharmacoeconomic models.16 Achieving TFR is important from a clinical point of view because it implies the absence of disease and treatment, and the patient would be free of the AE of drugs. Clinical practice is increasingly moving in this direction and in patients who have been achieving DMR for long periods of time, treatment discontinuation should be attempted. Moreover, from the economic point of view, this is the best scenario because the cost of the drugs is a major factor in the total cost of the disease.
In this model, OS is reliant on the transition probabilities within the model, which is also an assumption. This constitutes one of the model's limitations. The model's target population encompassed refractory and intolerant patients to previous lines of treatment, which may constitute another limitation due to potential differences in response between refractory and intolerant patients. Moreover, the model does not incorporate the parameter of TTD rates for each alternative, and this omission may influence in the final outcomes. These limitations could affect to extern validity of the model. This model does not incorporate the cost of AE of drugs, but the impact of AEs in the efficacy of the model is assumed by the incorporation of quality-of-life data, which is a reflect of the effect of the AEs. Another limitation of the study is that the data used in the comparison with ponatinib are from an indirect comparison.
As indicated by the tornado diagram, the variation in the drug costs exert a significant influence on the total cost of the disease; therefore, it is important to establish a price that optimizes the use of each alternative. In the asciminib vs ponatinib model, a 10% increment in the price of asciminib results in a change in the ICER sign. This implies that, in this scenario, ponatinib would be a dominant alternative over asciminib (Fig. 3A). The price of asciminib in Spain has recently been established at €5,369,17 which matches the price of ponatinib. This constitutes an 11% increase from the base case, placing us in a scenario similar to what was observed in the one-way sensitivity analysis. This suggests that ponatinib may be a superior alternative to asciminib. This information is crucial for considering the application of discount rates to the drugs and their implications on the ICER. In the asciminib vs bosutinib model, the parameter with the greatest influence on the model is the discount rate. An increase in the discount rate to 6% implies a decrease in the ICER with respect to the base case, reaching a value of €34,121 per QALY (Fig. 3B). BP costs have a minor influence in both models, despite being the phase with the highest costs derived from hospitalization. The selection of the cost range in the one-way analysis was arbitrary, but it serves to assess the impact of drug costs on the model. The discount rate selected ranged from 0 to 6% to obtain a range from no discount rate to a high discount rate and evaluate the influence on the model.
In NICE appraisal,13 asciminib is positioned as a more effective alternative than bosutinib, and, by applying a confidential discount to asciminib the ICER was £30,000 per QALY when comparing asciminib vs bosutinib. According to our model, a discount rate of up to 42% over the base case is required to achieve an incremental ICER of €30,000 per QALY for asciminib. The results obtained in the asciminib vs ponatinib model align closely with those reported in the NICE appraisal. It is concluded that asciminib represents a cost-saving alternative to ponatinib, primarily due to similar efficacy results and lower costs. This approximation should be interpreted with caution due to the difference in currency used.
In healthcare decision-making, calculating the budgetary impact of an intervention is a relevant factor. The incidence of CML in Spain is over 1.08 cases per 100,000 inhabitants per year. Based on these data, including the calculated incremental cost per patient, we calculated the budgetary impact of using asciminib. The extra annual budgetary impact up to €106,300 when compared asciminib vs bosutinib and €15,800 when compared asciminib vs ponatinib. The increased social and therapeutic value resulting from expanding treatment options justifies the calculated incremental spending. Therefore, clinical decision-making should be based on the clinical characteristics of patients and the AE profile of the drugs, rather than solely on the costs associated with alternatives. Furthermore, selecting drugs based on AE profile and patient’s characteristics may improve outcomes by reducing AE rates and therefore decreasing associated costs.
ConclusionAsciminib is a new therapeutic alternative for third-line CML patients with a novel mechanism of action. The effectiveness in terms of utility is similar to ponatinib and superior to bosutinib resulting in an ICER of €175,135.6 and €47,010.49, respectively. Drug cost is the factor with the greatest impact on the total cost of disease and the discount rate also has an important impact on the asciminib vs bosutinib model. Despite being a third-line drug, the TFR approach is becoming more frequent in clinical practice in patients with DMR and needs to be incorporated in pharmacoeconomic studies. The annual budgetary impact of using asciminib amounts to €106,000 and 15,800 compared to bosutinib and ponatinib, respectively. Increasing the therapeutic alternatives is necessary in patients refractory or intolerant to two lines of treatment and the choice to use asciminib should be based on the patient characteristics.
FundingThis research has not received any funding.
Ethical considerationsData used in this study are obtained from literature. All cited sources have been correctly attributed, and careful attention has been paid to respecting intellectual property rights. Although no direct human subjects were involved, this study adheres to fundamental ethical principles of research and academic integrity.
CRediT authorship contribution statementAntonio García Molina: Writing – review & editing, Writing – original draft, Validation, Methodology, Investigation, Formal analysis, Conceptualization.

Supplementary material

