
Pharmacogenetics evaluates how genetic variations influence drug responses. Nowadays, genetic tests have advanced, becoming more affordable, and its integration is supported by stronger clinical evidence. Guidelines such as those from CPIC (Clinical Pharmacogenetics Implementation Consortium) and resources like PharmGKB facilitate genotype-based prescribing; and organizations like the FDA promote genetic testing before initiating certain medications. Preventive pharmacogenetic panels seem promising, but further research on biomarkers and diverse populations is needed. The aim of this review is to analyze recent evidence on the genotype–drug response relationship to examine how the genetic profile of patients influences the clinical response to treatments, and analyze the areas of research that need further study to advance towards a genetic-based precision medicine.
Materials and methodsA systematic search was conducted on PubMed to identify articles investigating the genotype–drug response relationship. The search strategy included terms such as “pharmacogenetics”, “personalized treatment”, “precision medicine”, “dose adjustment”, “individualizing dosing”, “clinical routine”, and “clinical practice.” Clinical trials, observational studies, and meta-analyses published in English or Spanish between 2013 and 2023 were included. The initial search resulted in a total of 136 articles for analysis.
Results49 articles were included for the final analysis following review by 2 investigators. A relationship between genetic polymorphisms and drug response or toxicity was found for drugs such as opioids, GLP-1 agonists, tacrolimus, oral anticoagulants, antineoplastics, atypical antipsychotics, efavirenz, clopidogrel, lamotrigine, anti-TNFα agents, voriconazole, antidepressants, or statins. However, for drugs like metformin, quetiapine, irinotecan, bisoprolol, and anti-VEGF agents, no statistically significant association between genotype and response was found.
ConclusionThe studies analyzed in this review suggest a strong correlation between genetic variability and individual drug responses, supporting the use of pharmacogenetics for treatment optimization. However, for certain drugs like metformin or quetiapine, the influence of genotype on their response remains unclear. More studies with larger sample sizes, greater ethnic diversity, and consideration of non-genetic factors are needed. The lack of standardization in analysis methods and accessibility to genetic testing are significant challenges in this field. As a conclusion, pharmacogenetics shows immense potential in personalized medicine, but further research is required.
La farmacogenética evalúa cómo variantes genéticas influyen en la respuesta a medicamentos. En la actualidad las pruebas genéticas han avanzado, son más asequibles y su integración se respalda con evidencia clínica más sólida. Guías como las del CPIC (Clinical Pharmacogenetics Implementation Consortium) y recursos como PharmGKB facilitan la prescripción basada en genética; y organizaciones como la FDA promueven realizar determinaciones genéticas previo inicio de ciertos medicamentos. Los paneles farmacogenéticos preventivos se muestran prometedores, pero se requiere investigar más biomarcadores y poblaciones diversas. El objetivo de esta revisión es analizar la evidencia reciente en la relación genotipo-respuesta para examinar cómo influye el perfil genético de los pacientes en la respuesta a tratamientos, y analizar las áreas de investigación que necesitan más estudios para avanzar hacia una medicina de precisión basada en genética.
Materiales y métodosSe realizó una búsqueda sistemática en PubMed para identificar artículos que investigaran la relación genotipo-respuesta a fármacos. La estrategia de búsqueda incluyó términos como «pharmacogenetics», «personalized treatment», «precision medicine», «dose adjustment», «individualized dosing», «clinical routine», and «clinical practice». Se incluyeron ensayos clínicos, estudios observacionales y metaanálisis en inglés o español entre 2013–2023. La búsqueda inicial resultó en 136 artículos.
ResultadosSe incluyeron 49 artículos para su análisis final tras la revisión de dos investigadores. Se encontró relación entre polimorfismos genéticos y respuesta/toxicidad para fármacos como: opioides, agonistas GLP-1, tacrólimus, anticoagulantes orales, antineoplasicos, antipsicóticos atípicos, efavirenz, clopidogrel, lamotrigina, anti-TNFα, voriconazol, antidepresivos o estatinas. Sin embargo, para fármacos como metformina, quetiapina, irinotecán, bisoprolol y anti-VEGF no se encontró asociación estadísticamente significativa.
ConclusiónLos estudios analizados en esta revisión sugieren una fuerte correlación entre la variabilidad genética y la respuesta individual a fármacos, respaldando la importancia de usar la farmacogenética para la optimización de tratamientos. Sin embargo, para ciertos fármacos como metformina o quetiapina la influencia del genotipo sigue siendo poco clara. Son necesarios más estudios con mayor tamaño de muestra, más diversidad étnica y contemplando factores no genéticos. La falta de estandarización en los métodos de análisis y la accesibilidad a las pruebas genéticas son desafíos importantes en este campo. En resumen, la farmacogenética muestra un potencial enorme en la medicina personalizada, pero se requiere aún más investigación.
Pharmacogenetics has emerged as a promising field in personalized medicine, revolutionizing the way we approach pharmacological treatment by allowing a more precise and effective personalization of therapies. It is now a fundamental component of precision medicine, helping to improve the safety and efficacy of treatments.1
Pharmacogenetics investigates how genetic variations between individuals affect the pharmacokinetics and pharmacodynamics of drugs and how this influences drug response. These variations can determine the efficacy of enzymes and proteins involved in drug metabolism, interaction with cellular receptors or intracellular signaling pathways.1 Through the identification of specific genetic biomarkers, it is possible to predict how a patient will respond to certain drugs, and thus be able to choose the most appropriate treatment and adjust dosages to achieve optimal results.
In recent decades, the scientific evidence in the field of pharmacogenetics has increased enormously. The technology for genetic testing has advanced, the clinical evidence supporting the integration of pharmacogenetics into clinical practice is much stronger, and the price of testing has fallen.2 Today, evidence-based guidelines have allowed the interpretation of pharmacogenetic information and its application in clinical practice. Resources such as the CPIC (Clinical Pharmacogenetics Implementation Consortium)3 guidelines or the PharmGKB website (https://www.pharmgkb.org/) assist in prescribing drugs adjusted for genetic data.
Pharmacogenetics has found applications in the treatment of various diseases, such as cardiovascular or neurological diseases, psychiatric disorders, cancer, analgesia, and infectious diseases, among others. Also health administrations such as the FDA already include recommendations for genetic testing prior to the use of certain drugs.
However, despite significant advances in the field of pharmacogenetics, there are still research needs that must be addressed to fully exploit its potential. One of the key challenges deals with the identification of new relevant genetic biomarkers and a deeper understanding of their impact on pharmacotherapy. In addition, further research in diverse populations is required to ensure that the results are applicable to different ethnic and geographic groups.
Currently, there is a growing interest in applying pharmacogenetic screening of a panel of genes rather than the determination of a single gene–drug pair.4 There is sufficiently strong evidence that preventive pharmacogenetic screening is more cost-effective than individual genetic testing. As they have similar costs and screening can prevent potential adverse effects, this strategy would save time and avoid the higher healthcare costs associated with such adverse effects.2
The realization of these pharmacogenetic panels has enormous potential, but in implementing them, the gene–drug relationship must be well studied. This will allow the selection of those genes and variants that have sufficiently solid evidence to be included in the panel, whose results have sufficient evidence to be used to guide the treatment of patients. In this review, we aim to address the current state of pharmacogenetics as well as review the evidence on the genotype–drug response relationship published in recent years in order to analyze how patients' genotypes influence the clinical response to treatments. We will also analyze the areas of research that need further study to advance towards a more personalized medicine based on genetic evidence.
Materials and methodsA systematic search was performed in the PubMed database to identify articles between years 2013 and 2023 investigating the application of pharmacogenetics in treatment optimization. The search strategy was designed using the following search terms: “pharmacogenetics”, “personalized treatment”, “precision medicine”, “dose adjustment”, “individualizing dosing”, “clinical routine”, and “clinical practice.”
The search strategy was applied to all fields of the bibliographic records, including title, abstract, keywords, and full text, and Boolean operators (AND/OR) were used to combine relevant terms. We filtered by article type including “observational study”, “randomized controlled trial”, “clinical trial”, “meta-analysis”, and “multicenter study.” The initial search showed a total of 136 articles.
Inclusion criteria- -
Adult/pediatric patients of any sex or ethnicity.
- -
Clinical trials, observational studies, or meta-analyses.
- -
Articles studying the relationship between genotype and drug response.
- -
Not studying the relationship between genotype and drug response.
- -
Language other than English or Spanish.
- -
Studies that were not carried out in vivo in humans.
- -
Not available in full text.
Two investigators independently reviewed the titles and abstracts of the articles identified in the initial search. Then, the full texts of the selected articles were evaluated according to the inclusion and exclusion criteria mentioned above. Discrepancies were resolved by discussion and consensus among the investigators. In case of disagreement, a third reviewer was consulted for a final decision.
Data analysis
Once the articles to be included were selected, they were analyzed, and the following data were extracted:
- -
Drug
- -
Gene
- -
Phenotype studied
- -
Type of study: Clinical trial (CT), observational study (OS), prospective/retrospective, multicenter, meta-analysis (MA).
- -
Sample size
- -
Aims of the article
- -
Intervention performed
- -
Outcomes measured
- -
Limitations
- -
Conclusions.
The risk of bias was assessed using the Cochrane Risk of Bias tool (RoB) for CT, and ROBINS for OS (Supplementary fig. 1A and 1B).
ResultsAfter the initial search, several articles were excluded for various reasons, such as unavailability in full text, publication in a language other than English or Spanish, or lack of relevance to the review's objective (Fig. 1).
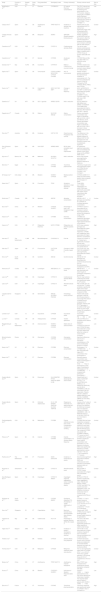
As a result of this selection process, 49 articles were identified that met the inclusion criteria and were included in the final analysis (Table 1).
Compilation of articles considered in the systematic literature review.
| Study | Country of study | Sample size | Study type | Drug prescribed | Genotype(s) used | Primary outcome(s) | Primary outcome result | Risk of bias |
|---|---|---|---|---|---|---|---|---|
| Abdelhady et al.23 | USA | 57 | CT | Efavirenz | CYP2B6*6*6 | QT interval Efavirenz concentrations | The QTcF interval was significantly increased 6 h following EFV administration in the *6/*6 carriers. Subjects carrying two CYP2B6*6 alleles displayed significantly higher EFV exposure than carriers of the CYP2B6*1/*6 and CYP2B6*1/*1. | Low |
| Casajus et al.5 | Spain | 109 | OS | Azathioprine (AZA) | TPMT NUDT15 | Incidence of adverse drug reactions | Patients with low and intermediate NUDT15 activity have significantly higher risks of developing AZA-induced leukopenia. | Unclear |
| Castaño-Amores et al.41 | Spain | 4899 | MA | Bisoprolol | ADRB1 | SBP/DBP (Systolic/diastolic blood pressure) | ADRB1 Arg389Gly (rs1801253) is the one that seems to affect the most the response to bisoprolol but the results have not been confirmed with the meta-analysis. | High |
| Cavallari et al.28 | USA | 1815 | CT | Clopidogrel | CYP2C19 | Cardiovascular adverse effects | The risk for major adverse cardiovascular events was significantly higher in patients with a CYP2C19 loss-of-function allele (IMs and PMs). | Low |
| Cavallari et al.7 | USA | 504 | CT | Opioids | CYP2D6 | Acute pain control | CYP2D6 PMs and IMs may attain little to no relief from some opioids. | Low |
| Danese et al.18 | Italy | 15,754 | MA | Coumarins | CYP4F2*3 | Effect of CYP4F2*3 on coumarin dosing | CYP4F2 variation was associated with higher coumarin doses needed in T allele carriers. | Low |
| Dapía et al.42 | Spain | 106 | OS | Voriconazole | CYP2C19 FMO3 NR1I2 POR CYP2C9 CYP3A4 | AUC of voriconazole | Genetic variation partially contributes to the interindividual variability of voriconazole AUC. The one that contributes the most is CYP2C19. Followed by POR, CYP2C9, NR1I2, FMO3, and CYP3A4. | Unclear |
| Davis et al.10 | USA | 169 | OS | Cannabidiol (CBD) | AOX1 SLC15A1 ABP1 | Change in seizure frequency | AOX1 rs6729738 CC and ABP1 rs12539 were associated with greater, and SLC15A1 rs1339067 TT and CYP2D6 rs28371725 with lower CBD response. | Low |
| Dawed et al.11 | UK | 4571 | OS | GLP-1 agonists | ARRB1 GLPR1 | HbA1c reduction | GLP1R rs6923761 (Gly168Ser) and ARRB1 rs140226575 (Thr370Met) were associated with HbA1c reduction after treatment with GLP-1 agonist. | Low |
| Degorter et al.43 | Canada | 299 | OS | Statins | SLCO1B1 ABCG2 | Statins concentration | Plasma rosuvastatin concentration was higher in individuals with SLCO1B1 c.521C and ABCG2 c.421A. Plasma atorvastatin concentration was higher in individuals with SLCO1B1 c.521C but lower in those patients with SLCO1B1 c.388G. | Low |
| Dias et al.39 | Australia | 1823 | MA | Irinotecan | UGT1A1*28 | Overall survival Progression-free survival | The difference in the survival (OS, PFS) between patients of different UGT1A1*28 genotypes who had received irinotecan was not statistically significant. | Low |
| Díaz-Villamarin et al.45 | Spain | 880 | MA | Anti-VEGF | ARMS2 A69S | BCVA (best-corrected visual acuity) improvement | No statistically significant association was found between the efficacy of anti-VEGF drugs and the ARMS2 A69S variant. | Low |
| Dujic et al.12 | Bosnia, UK | 7656 | MA | Metformin | SLC22A1 SLC47A1 | HbA1c reduction | None of the variants were significantly associated with glycemic response to metformin. | Low |
| Ebid et al.13 | Egypt | 78 | OS | Tacrolimus | CYP3A4 CYP3A5 | Tacrolimus plasma levels | Tacrolimus trough levels were significantly higher in CYP3A4*22 and CYP3A5*3 than in CYP3A4*1 and CYP3A5*1. | Low |
| El Rouby et al.17 | USA, Qatar | 132 | MA | Warfarin | VKORC1 CYP2C9 | Weekly warfarin dose | CYP2C9 rs4086116 T-allele had lower weekly warfarin dose compared to homozygous C-allele. | Low |
| Gassó et al.47 | Spain | 83 | OS | Fluoxetine | TPH2 | Symptoms reduction in major depressive disorder | Three SNPs (rs11179002, rs60032326, and rs34517220) were significantly associated with higher clinical improvement after treatment with fluoxetine. | Low |
| Gulilat et al.15 | Canada | 358 | OS | Apixaban | ABCG2 | Apixaban concentration | ABCG2 c.421C>A genotype was identified as a predictor of increased apixaban concentration. | Unclear |
| Guo et al.20 | China | 551 | CT | Warfarin | CYP2C9 VKORC1 | Percentage of time in the therapeutic range of INR | CYP4F2*3 variant is associated with an increase in warfarin dose requirements to achieve the therapeutic range of INR. | Low |
| Haas et al.22 | USA | 72 | CT | Efavirenz | CYP2B6 | Efavirenz concentration | CYP2B6 slow metabolizer genotypes were associated with higher plasma efavirenz concentrations. | Low |
| Haas et al.21 | USA | 128 | CT | Rifapentine Efavirenz | NAT2 CYP2B6 | Rifapentine and efavirenz plasma levels | NAT2 slow acetylator genotype was associated with higher concentrations of rifapentine. CYP2B6 poor metabolizer were associated with higher efavirenz concentration. | High |
| Ham et al.49 | The Netherlands | 11,485 | MA | Benzodiazepines | CYP2C9*2/*3 | Fall risk | Carriers of CYP2C9 *2 or *3 allele had a significantly increased fall risk using benzodiazepines, and non-carriers did not. | Low |
| Kato et al.48 | Japan | 168 | CT | Fluvoxamine | 5-HTTLPR FGF2 | Changes in HAM-D score at week 6 | 5-HTTLPR LA/S′ and FGF2 RS1449683C/T were significantly associated with HAM-D change. | Low |
| Kim et al.35 | South Korea | 65 | OS | Sunitinib | ABCG2 | Sunitinib toxicity | ABCG2 421 AA genotype was associated with sunitinib-induced toxicity such as thrombocytopenia, neutropenia, and HFS. | Unclear |
| Klarica et al.46 | Croatia | 205 | OS | Lamotrigine | ABCG2421C > A | Lamotrigine levels | ABCG2 421C>A was associated with lower troughs of lamotrigine compared to the wild-type. | Unclear |
| Lee et al.29 | USA | 1193 | OS | Clopidogrel | CYP2C19 | Cardiovascular adverse effects risk | Risk for major adverse cardiovascular events was significantly higher in LOF carriers. | Low |
| Lee et al.26 | USA | 2817 | CT | Clopidogrel | CYP2C19 | Atherothrombotic event | PMs and IMs (who did not carry the *17 allele) exhibited a significantly higher risk of major atherothrombotic events compared to NMs. | Low |
| Limviphuvadh et al.36 | Singapore | 90 | OS | Gemcitabine | ABCG2 SLC29A3 POLR2A | Hematology toxicity Survival | Patients with CA/AA genotype of ABCG2 Q141K were shown to have longer PFS and an increased toxicity compared to CC genotype. Patients with CT/TT genotype of SLC29A3 S158F were shown to have longer median OS compared to CC genotype. | Low |
| Linares et al.8 | USA | 15 | CT | Oxycodone | CYP2D6 | Oxycodone levels | Oxycodone concentrations were PM>EM>UM | Unclear |
| Lu et al.31 | Canada | 148 | OS | Antipsychotics | CYP2D6 | Tardive dyskinesia | UMs and PMs are at increased risk for tardive dyskinesia. | Low |
| Maagdenberg et al.19 | The Netherlands | 175 | OS | Acenocoumarol | VKORC1 CYP2C9 CYP4F2 | Stable dosis of acenocoumarol | VKORC1, CYP2C9*2/CYP2C9*3 and CYP3A4*22 were associated with a lower log mean stable dose when the number of variant alleles increased. | Low |
| Miroshnichenko et al.32 | Russia | 49 | OS | Olanzapine | CYP2D6 CYP1A2 | Olanzapine concentration | Significant differences were found in olanzapine concentrations in PM (G/A) and EM (G/G) groups of CYP2D6. | Low |
| Neary et al.24 | UK | 40 | OS | Efavirenz | CYP2B6 | Efavirenz concentration | Homozygous T of CYP2B6 516G>T was associated with higher EFV concentration than homozygous G. | Unclear |
| Neary et al.25 | UK | 57 | CT | Efavirenz | CYP2B6 | Efavirenz concentration | Efavirenz plasma concentration was higher in homozygous T for CYP2B6 516G>T than in homozygous G; and higher in participants heterozygous CT for CYP2B6 983T>C compared with participants homozygous T. | High |
| Ovejero-Benito et al.50 | Spain | 78 | OS | Etanercept | HLA-B MAP3K1 PTTG1 ZNF816A GBP6 IL12B | Response to etanercept at 3 and 6 months | Patients with the C allele of rs2431697 (PTTG1), T of rs13437088 (HLA-B/MICA), C of rs9304742 (ZNF816A), and AA-GG of rs2546890 (IL12B) are more likely to be non-responders. Patients with the C allele for rs96844 (MAP3K1) and AG-GG of rs928655 (GBP6) are more likely to respond. | Unclear |
| Ovejero-Benito et al.51 | Spain | 95 | OS | Infliximab Adalimumab | IVL IL-12B NFKBIA ZNF816A SLC9A8 TNFR1B | Response to infliximab and adalimumab at 3 and 6 months | Carriers of the T allele of rs6661932 IVL, G of NF-κB and G for rs645544 SLC9A8 had increased risk of no response. Carriers of A allele in rs2546890 IL-12B, C of ZNF816A and G in rs1061624 (TNFR1B) are more likely to respond. | Low |
| Packiasabapathy et al.9 | USA | 53 | OS | Methadone | CYP2B6 | Plasma methadone levels Pain scores Postoperative nausea and vomiting | CYP2B6 PMs had lower metabolism compared with NMs. TT variants of rs4803419 have lower pain scores compared with the wild type (CC). The incidence of PONV was greater with CYP2B6 rs1038376 (TT) variant vs AA/AT. | Unclear |
| Peña et al.34 | Spain | 26 | OS | Imatinib | CYP2B6 CYP3A4 | Imatinib concentration t1/2 Adverse effects frequency | CYP2B6 G516T carriers showed a significant lower imatinib concentration and elimination t1/2. The frequency of adverse effects was significantly reduced in CYP3A4 polymorphism carriers (*22/*22,*1/*20 and *1/*22) compared to *1/*1 carriers. | Low |
| Postmus et al.44 | The Netherlands | 5244 | CT | Pravastatin | ODZ4 DNAJC5B | Incidence of cardiovascular events | Genome wide significant associations between SNPs and cardiovascular event reduction by pravastatin treatment were not observed. | High |
| Russman et al.27 | Switzerland | 56 | OS | Clopidogrel | CYP2C19 | Atherothrombotic event | IMs and PMs of CYP2C19 were associated with a higher risk of thrombotic events. | Unclear |
| Saiz-Rodriguez et al.30 | Spain | 144 | OS | Clopidogrel | CYP2C19 ABCB1 | Clopidogrel response (aggregation value, incidence of adverse effects) | IM-PM of CYP2C19 showed a significantly higher aggregation value. Patients with ABCB1 C3435T, C1236T and G2677T/A variants had lower aggregation value. The incidence of ischemic events was lower in CYP2C19 UM compared to IM-PM and NM. | Low |
| Shilbayeh et al.33 | Saudi Arabia | 34 | CT | Quetiapine | CYP3A5 ABCB1 | Quetiapine clearance PTA (Probability of Target Attainment) at 12 h | CYP3A5 *1/*1 had a greater clearance compared with *1/*3 y *3/*3. The PTA at 12 h in *1/*1 was lower compared to *1/*3 and *3/*3 individuals. | Unclear |
| Soo et al.37 | Singapore | 23 | CT | Capecitabine | TSER | Maximum tolerated dose Recommended dose Adverse effects | Patients with TSER (TYMS enhancer region) 3R/3R genotype showed higher tolerance to capecitabine. | High |
| Talamonti et al.52 | Italy | 255 | OS | Ustekinumab | HLA-C*6 | Percentage of patients reaching ΔPASI 50 at week 4 | The HLA-C*06 allele was found to be associated with a significantly greater and faster response to ustekinumab therapy. | Low |
| Tejpar et al.38 | Belgium | 2982 | CT | Irinotecan | UGT1A1 | Incidence of grade III neutropenia Incidence of diarrhea | UGT1A*28 7/7 was associated with a higher incidence of grade III and IV irinotecan-induced neutropenia but not with diarrhea. | Low |
| Theken et al.3 | USA | MA | NSAIDs | CYP2C9 | Adverse effects Drug exposure | CYP2C9 decreased function and no function alleles are related with an elevated NSAID exposure and major risk of adverse effects. | Unclear | |
| Thomas et al.40 | USA | 37 | OS | Metoprolol | CYP2D6 | Metoprolol clearance Heart rate reduction | The CL was significantly higher with an CYP2D6 AS of 1 vs. an AS of 0. There was a greater reduction in HR among those with AS of 1 compared to an AS of 2–2.25. | Unclear |
| Wang et al.6 | China | 219 | CT | Azathioprine | TPMT NUDT15 | Azathioprine-induced leukopenia | IMs of TPMT have increased risk of azathioprine-induced leukopenia compared with NMs. | High |
| Xia et al.16 | China | 2160 | OS | Warfarin | CYP2C9*3 VKORC1 | Initial dose of Warfarin Required stable dose | VKORC1-1639G>A gene polymorphism is the main factor affecting the initial dose of warfarin. The required stable dose is higher in patients with VKORC1-1639G>A GG. | Low |
| Zhao et al.14 | France | 22 | CT | Tacrolimus | CYP3A5 | Tacrolimus pharmacokinetics | Tacrolimus clearance was significantly higher in CYP3A5*1 than in CYP3A5*3*3. | High |
PM = poor metabolizer, IM = intermediate metabolizer, EM = extensive metabolizer, NM = normal metabolizer, UM = ultra-rapid metabolizer, LOF = loss-of-function, CT = clinical trial, OS = observational study, MA = meta-analysis, HFS = hand-foot syndrome, AS = activity score.
In the study by Casajus et al.,5 it was observed that TPMT variants were rare (1.4%) and were not significantly associated with azathioprine (AZA)-induced leukopenia in Chinese patients with inflammatory bowel disease (IBD). On the other hand, patients with low and intermediate NUDT15 activity had a significantly increased risk of developing leukopenia. The incidence of an aberrant variant of NUDT15 was 10.0%, significantly higher than that of TPMT (P=.000). This suggests that NUDT15 could be an important pharmacogenetic marker for predicting AZA-induced leukopenia in a Chinese cohort (P=0.004).
In the study by Wang et al.,6 a similar trend in the incidence of adverse reactions was observed between normal metabolizers (NMs) and intermediate metabolizers (IMs) (27.8% vs. 37.5%, P=0.309) after genotype-guided dose reduction of AZA in IMs. However, despite the initial dose adjustment, IMs still had a higher risk of adverse events. No IMs completed the 6-month follow-up period suggesting that toxicity still occurs in this group of patients even after dose reduction. Therefore, continued monitoring of these patients is necessary. TPMT genotyping makes a valuable contribution to identifying patients at increased risk of developing adverse effects from AZA in the Caucasian population.
OpioidsIn the study by Cavallari et al.,7 the response to opioids was investigated as a function of CYP2D6 phenotype. Lower concentrations of the active metabolite hydromorphone were observed in poor metabolizers (PMs) and IMs, which may reduce the analgesic efficacy of the drug. These phenotypes may experience little or no relief with some opioids prescribed for post-surgical pain, such as hydrocodone, tramadol, and codeine. Consequently, it is recommended not to use CYP2D6-metabolized opioids in PMs and IMs.
In the study by Linares et al.,8 they focused on oxycodone and its relationship with different metabolization phenotypes. They observed that the mean elimination time (t1/2) of oxycodone followed the order of PM > extensive metabolizer(EM) > ultra-rapid metabolizer (UM) (P<.01), while the elimination rate (ke) and clearance (Cl) followed the opposite order: UM > EM > PM (P<.01). In UMs, oxymorphone (active metabolite of oxycodone) levels were consistently below the minimum effective concentration of 20 μg/L oxycodone, so it would exert no analgesic effect on the central nervous system (oxymorphone levels derived from oral oxycodone are too low in vivo).
The study by Packiasabapathy et al.9 examined methadone and its genetic associations with the occurrence of post-operative nausea and vomiting (PONV) and peak post-operative pain score. Novel associations of CYP2B6 with methadone and the occurrence of PONV were identified, specifically with the single nucleotide polymorphisms (SNPs) rs1038376 (P=0.001), rs2279343 (P=0.025), and rs11882424 (P=0.007). Slow CYP2B6 metabolizers (*6/*6) were found to have 2-fold slower methadone metabolism compared to NM/EM. The incidence of PONV was 4.7 times higher for the rs1038376 TT (P=0.00015) compared to AA/AT. The AG/GG variants of the rs2279343 SNP had a 2.86-fold higher incidence of PONV compared to the wild-type variant (AA). Associations were also observed between rs10500282, rs11882424, rs4803419, and peak pain scores. Those with TT variants of rs4803419 (P=0.049) reported lower scores compared to wild type (CC). Those with rs10500282 (P=0.010) and rs11882424 (P=0.013) variants reported higher scores compared to the reference group.
CannabidiolDavis et al.10 studied cannabidiol (CBD). Variants in AOX1, SLC15A1, and ABP1 were found to be associated with CBD response and affect CBD receptor expression in treatment-resistant epilepsy. Patients with AOX1 rs6729738 CC (P=0.001) and ABP1 rs12539 (P=0.002) were more likely to respond. On the other hand, patients with SLC15A1 rs1339067 TT (P=0.001) and CYP2D6 rs28371725 (P=0.02) were less likely to respond (94% and 77%, respectively). ABCC5 rs3749442 was associated with a lower likelihood of response, abnormal liver function tests, and a higher likelihood of sedation.
Oral antidiabeticsDawed et al.11 found that a common variant in the GLP1R gene, rs6923761 (Gly168Ser), and low-frequency variants in ARRB1 were associated with reduced HbA1c after treatment with GLP1R agonists. The Gly168Ser variant was significantly associated with glycemic response to these agonists, and each copy of the serine allele was associated with a lower HbA1c reduction of 0.08% (P=6.0×10⁻⁵).
As for ARRB1, rare variants were also associated with reduced HbA1c. Four variants contributed to this association: rs140226575 (Thr370Met), rs78979036 (Thr275Ile), rs58428187 (Ile158Val), and rs78052828 (Gly411Ser). Carriers of one or more of these variants showed a greater reduction in HbA1c compared to individuals without these variants (P<0.0001). Nearly 4% of the study population with these low-frequency variants respond 30% better to GLP1R agonists compared to 9% with normal ARRB1 but 2 variants in GLP1R. Of note, neither GLP1R nor ARRB1 variants were associated with glycemic response to drugs other than GLP1R agonists.
On the other hand, the study by Dujic et al.12 consisted of a meta-analysis that evaluated whether genetic variants influence the response to metformin. This meta-analysis had a statistical power of 80%, enabling the detection of allelic effects that reduced HbA1c by more than 0.14% (P=0.005). However, the results did not show a significant association between any of the variants previously reported to be associated with metformin effect and glycemic response to metformin.
TacrolimusEbid et al.13 found that blood tacrolimus levels were significantly higher in CYP3A4*22 carriers compared to CYP3A4*1 carriers (P=0.045). In addition, they observed that levels were significantly lower in NMs (CYP3A5*1/CYP3A4*1*1) compared to IMs (CYP3A5*3*3/CYP3A4*1*1) and PMs (CYP3A5*3*3/CYP3A4*22) (P=0.015). Tacrolimus dose was also significantly lower in the PMs group compared to IMs/NMs (P=0.015). On the other hand, Zhao et al.14 also found that tacrolimus clearance was significantly lower in patients with CYP3A5*3/*3 genotype compared to those with CYP3A5*1 genotype (P=0.01). These findings are consistent with previous studies in patients undergoing heart and kidney transplantation, suggesting that early identification of CYP3A5 and CYP3A4 genotype is essential for establishing and adjusting tacrolimus dosing.
Oral anticoagulantsThe study by Gulilat et al.15 on apixaban identified the ABCG2 c.421C>A genotype as a predictor of increased drug concentrations (P=0.04). Heterozygous and homozygous carriers would have 1.10- and 1.33-fold higher peak and trough apixaban concentrations, respectively, compared to carriers of the wild-type (CC) allele.
The article by Xia et al.16 highlighted VKORC1-1639G>A and CYP2C9*3 polymorphisms as the main factors influencing initial warfarin dosing. The VKORC1-1639G>A genotype explained 41.0% of the individual differences in initial dosing, while CYP2C9*3 explained 7.0%. It was also observed that patients with the VKORC1-1639G>A GG genotype required a relatively higher maintenance dose of warfarin.
In the study by Rouby et al.,17 variants in VKORC1 (rs9934438) and CYP2C9 (rs4086116) were documented to be strongly associated with warfarin dose requirements in the North African and Middle Eastern population (P=2×10⁻¹⁶ and P=1.1×10⁻⁵, respectively). These variances explained approximately 39% and 27% of the variability in Qataris and Egyptians, respectively. In addition, patients carrying the T allele of rs4086116 were observed to have a significantly lower weekly warfarin dose compared with homozygotes of the C allele.
In the study by Danese et al.,18 they also analyze the contribution of CYP4F*3 polymorphism (rs2108622) on coumarin dose (warfarin and acenocoumarol). Carriers of the T allele of this variant were found to be associated with a higher dose requirement. CYP4F2*3 polymorphism showed significance in populations of Caucasian (P=0.002) and Asian (P=0.02) origin, but not in other ethnic groups. In addition, the effect of CYP4F2 was observed to be lower in warfarin than in acenocoumarol. T-allele carrier patients taking acenocoumarol required a higher dose compared to warfarin patients.
Maagdenberg et al.19 also studied acenocoumarol. In this study, VKORC1, CYP2C9*2/CYP2C9*3, and CYP3A4*22 showed an association with lower mean dose as the number of variant alleles increased (VKORC1, P<0.001; CYP2C9*2/CYP2C9*3, P=0.080; CYP3A4*22, P=0.067). The mean dose was significantly higher in patients with the VKORC1 GG genotype compared with the AG (P=0.010) or AA (P<0.001) genotype.
According to the studies reviewed, VKORC1 to a greater extent and CYP2C9 to a lesser extent are the genes that most influence warfarin dosing.16–19 Although in the study by Guo et al.,20 and in the study by Danese et al.,18 they also mention the CYP4F2*3 variant, associating it with a modest increase in warfarin dosing requirements.
RifapentineHaas et al.21 found that the NAT2 slow acetylator genotype is associated with higher concentrations of rifapentine (P=2.6×10⁻³) and/or 25-desacetyl rifapentine (P=7.0×10⁻⁵), which could produce toxicities such as hypersensitivity or hepatotoxicity. The mean rifapentine concentration at week 4 was 1.34-fold higher in slow acetylators compared with fast acetylators, whereas the concentration of 25-desacetyl rifapentine was 1.62-fold higher in slow compared with fast acetylators.
EfavirenzA significant association between the CYP2B6 516G>T variant and higher steady-state efavirenz concentrations was confirmed in several studies.21–25 Subjects homozygous for CYP2B6*6 (PMs) showed significantly higher steady-state efavirenz exposure (P<0.05) compared to CYP2B6*1/*6 and CYP2B6*1/*1 carriers.23 Haas et al.21 found that the mean efavirenz concentration was 5.9 higher in CYP2B6 PMs than in NMs. And also found an association with NAT2 genotype (P=9.7×10⁻⁶). Slow acetylators presented an increase in efavirenz concentrations with respect to baseline in 14% of cases. An elevation in transaminases was found in PMs of both genes.
Abdelhady et al.23 evaluated whether carriers of the CYP2B6*6 allele had increased QT interval prolongation. The QTcF interval (corrected QT interval by Fridericia) was not altered in NMs or IMs but was significantly increased 6 h after efavirenz administration in *6/*6 carriers (P=0.02). Demonstrating the increased risk of efavirenz-induced QT interval prolongation in CYP2B6*6 homozygotes.
ClopidogrelSeveral studies have shown that loss-of-function variants (IM and PM) of the CYP2C19 gene are associated with an increased risk of thrombotic events during clopidogrel treatment.26–29 In the study by Cavallari et al.,28 the risk of cardiovascular adverse effects was found to be significantly higher in patients with loss-of-function alleles treated with clopidogrel compared to alternative therapy (prasugrel) (P=0.013). In the study by Lee et al.,29 the same was observed (P<0.001). In another study by Lee et al.,26 they found that there was also a higher risk in PMs/IMs with respect to NMs (P=0.003), with those who did not carry the *17 allele (e.g.*1/*2) being at greater risk (P<0.001).
In the study by Saiz-Rodríguez et al.,30 it was found that patients with IM-PM variants of CYP2C19 showed greater platelet aggregation (P=0.004), and, therefore, a significantly worse response to clopidogrel. In addition, it was observed that the incidence of ischemic events was lower in UMs compared to IM-PMs and NMs. However, there was a higher incidence of bleeding events in UMs compared to NMs and IM-PMs, although this difference was not statistically significant. Regarding the ABCB1 gene, there was a tendency for lower aggregation rates and higher percentage of responders in patients with mutated ABCB1 C3435T, C1236T, and G2677T/A alleles (P=0.009).
Atypical antipsychoticsIn the study by Lu et al.31 on atypical antipsychotics, CYP2D6 phenotypes were observed to have a significant association with the occurrence of tardive dyskinesia (TD) in patients with schizophrenia (P=0.048). The results suggest that UMs and PMs have an increased risk of TD and experience greater severity in its manifestation. In addition, these phenotypes were found to have significantly higher AIMS (Abnormal Involuntary Movement Scale) scores than EMs and IMs (P=0.032).
In the study of Miroshnichenko et al.32 on olanzapine, polymorphisms in CYP2D6 were found to have a significant effect on the pharmacokinetics of olanzapine. Significant differences in drug concentrations were found between slow (G/A) and fast (G/G) CYP2D6 metabolizers (P=0.046). Although no differences were found between CYP1A2 A/A, A/C and C/C genotypes, a significant influence of CYP1A2*1F genotype on concentrations of CYP2D6 PMs was identified (P=0.046).
However, for quetiapine, although CYP3A5 NMs (*1/*1) have been shown to have a 29% higher clearance than PMs and IMs (*1/*3 and *3/*3), neither CYP3A5 nor ABCB1 are statistically significant predictors of quetiapine kinetics.33 Although it would not be recommended to dose according to CYP3A5 genotype, it could be useful to genotype in order to predict possible drug interactions at this level. Conversely, there is sufficient evidence to dose according to CYP3A4*22 genotype.34
AntineoplasticsIn the study by Peña et al.35 on imatinib, it was observed that carriers of the CYP2B6 G516T genotype had significantly lower concentrations and faster clearance of imatinib compared to non-carriers of this variant (P=0.022 and P=0.041, respectively). In addition, the frequency of adverse effects was found to be significantly lower in CYP3A4 polymorphism carriers (*22/*22, *1/*20 and *1/*22) compared to *1/*1 carriers (P=0.033).
On the other hand, in the study by Kim et al.36 on sunitinib, the ABCG2 421AA genotype was found to be associated with an increased risk of adverse effects, such as thrombocytopenia (P=0.04), neutropenia (P=0.02) and hand-foot syndrome (P=0.01).
In the study by Limviphuvadh et al.37 on gemcitabine, the ABCG2 Q141K variant (c.421C>A, rs2231142) was associated with increased mean Progression-Free Survival (PFS) in non-small cell lung cancer. Patients with the CA/AA genotype showed a longer PFS compared to those with the CC genotype (P=0.007). In addition, the SLC29A3 S158F variant (c.473C>T, rs780668) was associated with longer Overall Survival (OS). Patients with the CT/TT genotype had a longer median OS compared to the CC genotype (P=0.017). The ABCG2 Q141K variant, in particular the CA/AA genotype, was also associated with increased toxicity (P=0.008). On the other hand, the wild-type CC genotype of the POLR2A N764K variant was associated with an increased risk of grade 3 or 4 thrombocytopenia compared to the CT genotype (P=0.048).
The study by Soo et al.38 on capecitabine reveals that patients with the TSER 3R/3R genotype show increased tolerance to this drug. The results of this phase I study suggest that it is feasible to administer higher doses in this subgroup of patients and thus benefit from further treatment intensification.
Tejpar et al.39 examined the use of irinotecan and found that the UGT1A*28 7/7 genotype was associated with a higher incidence of grade III and IV neutropenia during treatment (P<.001). However, in the meta-analysis by Días et al.,40 no statistically significant differences in survival (OS, PFS) were found between patients with different UGT1A1*28 genotypes who received irinotecan. And although a trend towards receiving one or more cycles with reduced drug doses was observed in the UGT1A1 *28/*28 and *1/*28 genotypes, this did not reach statistical significance either. Although no increase in survival has been demonstrated, genotyping could be useful in identifying patients who could benefit from higher doses of irinotecan without experiencing significant toxicity.
Beta-blockersIn the study by Thomas et al.41 with metoprolol, a significant association was found between CYP2D6 activity and response to metoprolol. Patients with lower CYP2D6 activity showed higher metoprolol exposure and a more pronounced cardiac response compared with those with a higher activity score (AS). Those with AS of 1 had greater heart rate reduction compared with AS of 2–2.25 (P<0.001). In addition, it was observed that clearance was significantly higher in patients with AS of 1 compared to an AS=0 (P=0.010).
On the other hand, Castaño-Amores et al.42 investigated which genetic polymorphisms affected bisoprolol, finding that the ADRB1 Arg389Gly gene (rs1801253) seems to have a significant impact on drug response. However, the results were not confirmed by meta-analysis and the influence of this gene on bisoprolol response remains unclear.
VoriconazoleDapía et al.43 investigated the influence of several genes on voriconazole levels creating a multifactorial predictive model for voriconazole AUC0-∞. The results revealed that genetic variation contributes partially to the variability in the area under the curve (AUC) of the drug. The gene that contributed the most to this variability was CYP2C19, accounting for 39% to global R2 of the model. It was followed by the POR gene with 18%, CYP2C9 with 8%, NR1I2 and FMO3 with 4% each, and finally CYP3A4 with 3%. These findings highlight the importance of the CYP2C19 gene in the response to voriconazole and suggest that other genes also play a role in the variability of drug levels.
StatinsFor rosuvastatin, in the study by DeGorter et al.,44 a higher plasma concentration was observed in individuals with the reduced function polymorphisms SLCO1B1 c.521C (P<0.0001) and ABCG2 c.421A (P<0.05). These factors explained 88% of the observed variability. Patients homozygous for the SLCO1B1 c.521C T>C variant are less likely to tolerate and continue statin therapy.
For atorvastatin, plasma drug concentration was higher in individuals with the SLCO1B1 c.521C allele (P<0.05), but lower in those patients with the SLCO1B1 c.388G allele (P<0.01). But these factors explained only 38% of the observed variability.
In the study by Postmus et al.,45 we sought to identify genetic variants associated with a clinically significant reduction in cardiovascular events by treatment with pravastatin. However, no significant associations were observed at the genomic level, indicating that the reduction in cardiovascular events by pravastatin was similar between SNP carriers and noncarriers. In this study, the most significant SNP (rs7102569, P=0.008) only explained <1% of the variability in clinical events, which is not clinically relevant. Of the SNPs previously analyzed in previous studies, only one was found to be statistically significant: rs13279522 of DNAJC5B (P=0.002).
Anti-VEGFDíaz-Villamarín et al.46 performed a meta-analysis to investigate the effect of different genetic variants on the response to anti-VEGF drugs, such as bevacizumab and ranibizumab. The genetic polymorphisms HTRA1 -625A/G (rs11200638), CFH I62V (rs800292), CFH Y402H (rs1061170) and, especially, ARMS2 A69S (rs10490924) have been associated with variation in response to these drugs, but the results are non-conclusive. The ARMS2 A69S (rs10490924) was the variant assessed to be related to anti-VEGF drug response in most of the publications of the systematic review. However, no statistically significant association was found in the meta-analysis (P=0.28).
LamotrigineIn the study by Klarica et al.,47 the ABCG2 421C>A variant was found to be associated with 20%–25% lower lamotrigine concentration compared with the wild-type allele. But this is unlikely to affect the efficacy of lamotrigine since the range of recommended lamotrigine troughs is rather wide. They found no effect of the MDR1/ABCB1 1236C>T (rs1128503) polymorphism on lamotrigine disposition. They were also unable to detect any relevant impact of UGT1A4*3 or UGT2B7 -161C>T on lamotrigine concentrations, which is contrary to previously published data.48
AntidepressantsIn the study of Gassó et al.49 on fluoxetine, three SNPs were found to be significantly associated with greater clinical improvement after fluoxetine treatment in pediatric populations. The most significant improvement was observed in homozygotes for the TPH2 rs34517220 GG, who showed a greater reduction in CDI (Children's Depression Inventory) score compared to carriers of the majority allele (AA + AG) (P=7x10⁻⁷). Higher efficacy was also observed in homozygotes for the minority allele of rs60032326 (P=0.006) and in carriers of 1 or 2 minority alleles of rs11179002 (P=0.0006).
In the study by Kato et al.50 on fluvoxamine, the 5-HTTLPR LA/S′ (P=0.029) and FGF2 rs1449683 CT (P=0.013) alleles were found to be significantly associated with changes in the HAM-D (Hamilton Depression Rating Scale), and thus influenced drug response.
BenzodiazepinesHam et al.51 found that carriers of CYP2C9*2 or *3 alleles on benzodiazepine treatment had a significantly increased risk of falls compared to untreated (P=4.98x10⁻⁵), whereas patients which did not carry these alleles did not have a significantly increased risk. In addition, it was observed that having more variant alleles was associated with an increased risk.
Biologic drugs in psoriasisOvejero-Benito et al.52 found significant associations between different genetic variants and response to etanercept treatment. Patients carrying the C allele of rs2431697 (PTTG1) (P=0.040), the T allele of rs13437088 (HLA-B/MICA) (P=0.020) and the C allele of rs9304742 (ZNF816A) (P=0.006) were more likely to be non-responders to etanercept. On the other hand, carriers of the C allele of rs96844 (MAP3K1)(P=0.009) had a higher probability of good response at 3 months. In addition, carriers of the AG-GG genotype for rs928655 (GBP6) (P=0.008) had a better response to etanercept at 6 months compared to AA carriers, while carriers of the AA-GG genotype for rs2546890 (IL12B) (P=0.044) had a limited response to anti-TNFα drugs.
In another study by Ovejero-Benito et al.,53 five SNPs were associated with PASI75 (Psoriasis Area and Severity Index) at 3 months in patients treated with adalimumab or infliximab. Carriers of the T allele of rs6661932 IVL (P=0.041), the G allele of NF-κB (P=0.037) and the G allele of rs645544 SLC9A8 (P=0.036) had an increased risk of not responding to adalimumab or infliximab, while carriers of the A allele of rs2546890 IL-12B (P=0.044) and the C allele of ZNF816A (P=0.008) were more likely to respond to these biologic drugs. At 6 months, only carriers of the G allele of rs1061624 TNFR1B (P=0.025) reduced the risk of non-response.
In the study by Talamonti et al.,54 an association was observed between the HLA-C*06 allele, an important polymorphism in psoriasis susceptibility, and clinical response to ustekinumab. The HLA-C*06 allele was significantly associated with a greater and faster drug response, with 71.7% of patients achieving a PASI50 at week 4 (P<0.0001).
DiscussionIn this review, we have explored the current evidence on the interaction between genetics and drug response. The results presented in the studies under analysis suggest a clear correlation between genetic variability and individual drug response. This finding supports the idea that personalizing doses according to the phenotype expressed by patients could significantly improve the efficacy and reduce the side effects of treatments. This is especially relevant in areas such as oncology, where treatment regimens are intensive and side effects can be severe.
However, for some drugs, the influence of genotype on their response remains unclear. Drugs such as metformin, quetiapine, irinotecan, bisoprolol, and anti-VEGF would require further research in order to be able to prove if genetics influences their effect, since no statistically significant associations were found in the meta-analyses reviewed.12,33,40,42,46
It is important to point out several limitations that were found in the studies analyzed. In the first place, several studies have a small sample size, which may limit the possibility to obtain generalizable results. In some cases, a retrospective design was used, which could introduce biases in the results by limiting the ability to perform a detailed follow-up of the patients. In addition, the lack of evaluation of non-genetic factors, such as comorbidities or the concomitant use of other drugs, can have a significant impact on treatment response and has not been considered in some studies. There is also a limitation in the representativeness of the study population, as some studies have focused on specific populations, such as patients from a single center or of a single ethnicity. This may limit the applicability of the results to other more diverse populations.
It is necessary to point out some problems that persist in the field of pharmacogenetics. One of the main challenges is the lack of standardization in the methods of analysis and interpretation of pharmacogenetic results. Variability in dosing recommendations according to genotype between different laboratories and health administrations can lead to confusion and lack of consistency in clinical practice.4 It is essential to address this issue by creating more uniform protocols and carrying out multidisciplinary work between prescribers and pharmacists to help the clinician to interpret pharmacogenetic information. Given that pharmacogenetics is still a relatively underdeveloped activity in pharmacy services,55 there is a pressing need to promote its implementation to ensure more standardized and effective practices.
The search for better biomarkers of clinical efficacy is essential to improve patient stratification and the selection of more appropriate treatments. Specifically, future studies with larger populations and a wider range of ethnicities should be conducted to confirm the evidence found to date.2
In addition, the availability of genetic testing and its accessibility are critical concerns. For genotype-based dose adjustment to be truly beneficial, it must be available to a broader spectrum of patients. This poses economic and ethical challenges that must be addressed proactively.
ConclusionsPharmacogenetics offers a promising path towards personalizing drug treatments, improving efficacy, and reducing toxicities. The studies analyzed suggest a clear correlation between genetic variability and individual drug response. However, additional research is still necessary to fully harness this potential and expedite the implementation of personalized medicine in clinical practice.
Declaration of authorshipThe conception and design of the work, data collection, analysis and interpretation of the data. Laura Amaro-Alvarez, Jaime Cordero-Ramos.
The writing of the article or its critical revision with important intellectual contributions: Laura Amaro-Alvarez, Jaime Cordero-Ramos, Miguel Ángel Calleja-Hernández.
Approval of the final version for publication: Laura Amaro-Alvarez, Jaime Cordero-Ramos, Miguel Ángel Calleja-Hernández.
FundingNone.
CRediT authorship contribution statementLaura Amaro-Alvarez: Writing – original draft, Investigation, Data curation, Conceptualization. Jaime Cordero-Ramos: Writing – review & editing, Writing – original draft, Project administration, Methodology, Investigation, Data curation, Conceptualization. Miguel Ángel Calleja-Hernández: Writing – review & editing, Writing – original draft, Validation, Supervision, Project administration, Methodology.

Supplementary material.

