


To improve the quality of the dispensing process and pharmaceutical care in the Outpatient Pharmacy through patient participation and Lean methodology, and to analyse the results obtained in terms of efficiency and patient satisfaction.
MethodProspective observational single-centre study. A working group was organized with the health care staff involved in outpatient care to apply Lean methodology and detect improvement opportunities. We used a focus group technique to understand the patients’ experience. The impact on patient satisfaction was measured through a mass survey mailed out in December 2019 (before introducing the main measures) and in December 2020.
ResultsMore than 30 improvement actions were identified after surveying the opinions of the patients and health care staff involved. Nine actions were prioritized, which were mainly related to structural and circuit changes. Waiting times significantly improved (35% of patients waited for more than 30 minutes before the improvement actions vs 4.5% afterward). The results showed that waiting times and overall satisfaction significantly improved in the period between the two surveys. In both cases, the degree of satisfaction was higher after introducing the improvement actions.
ConclusionsWe analysed the situation of our Outpatient Service and designed the most appropriate improvement actions according to the resources available. This initiative was achieved through patient participation (via a focus group and mass surveys), the participation of health care staff, and the application of Lean methodology.
Mejorar la calidad del proceso de dispensación y atención farmacéutica a pacientes externos mediante la participación del paciente y la aplicación de la metodología Lean y analizar los resultados obtenidos en cuanto a eficiencia e impacto en la satisfacción de los pacientes.
MétodoEstudio observacional, prospectivo y unicéntrico. Se creó un grupo de trabajo con los diferentes profesionales implicados en la atención al paciente externo para aplicar la metodología Lean y detectar oportunidades de mejora. Para conocer la experiencia del paciente se utilizó la técnica del grupo focal. El impacto en la satisfacción de los pacientes se midió mediante encuestas de satisfacción que se enviaron a través del correo electrónico en diciembre de 2019 (antes de implantar las principales medidas) y en diciembre de 2020.
ResultadosTeniendo en cuenta la perspectiva de los pacientes y de los profesionales sanitarios, se identificaron más de 30 acciones de mejora de las que se priorizaron 9, relacionadas fundamentalmente con cambios estructurales y de circuitos. Se consiguió mejorar significativamente los tiempos de espera (el 35% de los pacientes esperaban más de 30 minutos frente al 4,5% en el análisis realizado después de las intervenciones). Los aspectos que mostraron diferencias estadísticamente significativas en las encuestas entre los dos periodos fueron el tiempo de espera y la satisfacción global, en ambos casos el grado de satisfacción fue superior una vez implantadas las acciones de mejora.
ConclusionesLa participación del paciente, a través del grupo focal y encuestas masivas, unido a la participación de los profesionales sanitarios implicados en el proceso, a través de la metodología Lean, ha permitido analizar la realidad de nuestro servicio y diseñar las acciones de mejora más adecuadas en función de los recursos disponibles.
Hospital outpatient areas have become much busier in recent years, but lack the human and structural resources needed to meet this increased demand1. Improving patient care in outpatient areas should be considered a priority and Lean Management methodology can be a useful tool for quality improvements.
Lean Management is based on continuously improving the way in which we work by addressing the needs of patients and involving all health care staff by means of efficient processes. Lean Methodology defines value solely from the perspective of the customer or, in our case, patients. Any activity that helps in the treatment of patients adds value, whereas anything else is considered waste. There are a number of techniques that must be applied systematically to eliminate processes that do not add value for patients. The ultimate goal is to generate a new culture of improvement based on communication and teamwork2-4.
We identified several points in the dispensing and pharmaceutical care process that provided little value as well as processes that could be streamlined. Long waiting times for patients is a clear example of waste.
Lean Methodology was applied to improve the quality of the Outpatient Area by involving all staff who work in the outpatient care and dispensing processes. In our setting, Lean Methodology defines value from the patients’ perspective: thus, understanding their needs is fundamental to knowing where to focus our efforts in the improvement process.
The aim of this study was to improve the quality of outpatient dispensing and pharmaceutical care processes by involving patients and applying Lean Methodology. We also analysed the results in terms of efficiency and their impact on patient satisfaction.
MethodsDesignObservational prospective single-centre study.
ScopeThe study was conducted in a tertiary hospital with approximately 710 beds and a catchment area with a population of 540,000. In 2020, 16,500 outpatients were attended and over 80,000 dispensing processes were conducted.
Problem identification toolsThree processes were conducted to identify the needs of outpatients before we implemented improvements in the dispensing and pharmaceutical care process. These three processes were as follows: applying Lean Methodology, creating a focus group with patients, and conducting satisfaction surveys.
A multidisciplinary team was set up to analyse the dispensing and pharmaceutical care processes using Lean Methodology. The team comprised two technicians and two pharmacists from outpatient area, a resident pharmacist (FIR), the nursing supervisor of the Pharmacy Service, the pharmacy quality coordinator, a hospital infrastructure representative, and the head of the Pharmacy Service. The area's reference pharmacist completed a 20-hour theoretical-practical training course. During meetings, the team were assisted by an external company and a physician from the hospital with extensive experience in the application of Lean Methodology.
Four sessions (3-4 hours each) were held to identify waste and where improvement interventions could be applied. The following tools were used: (i) value stream mapping, which reveals all the actions that have to take place, both necessary and unnecessary, for patients to progress through the system from one stage to another; (ii) the A3 problem solving tool; and (iii) the Spaghetti Plot technique, which identifies unnecessary movements. All of these tools form part of the standard set of tools in Lean Methodology.
The team's results were shared with the rest of the staff in the area in order to obtain their input.
A group of 12 patients were invited to 3-hour group meeting to explore their experience at the Outpatient Pharmacy. These patients represented the main pathologies treated in the Outpatient Pharmacy: HIV patients, cancer patients, and patients undergoing treatment with biologics.
The main topics covered were information, health care and service, waiting times, and the characteristics of the physical space. We conducted a semi-structured interview with open-ended questions. All patients who participated in the focus group were sent a letter afterwards detailing the team's conclusions and the improvement actions to be enacted.
The results from the focus group interviews were used to create a questionnaire that was sent to all the other patients attended in the Outpatient Area. The aim was to measure patient satisfaction and obtain suggestions to improve both pharmaceutical care and logistics. One year later, we sent out the same questionnaire to measure the impact of the implemented improvement actions on patient satisfaction. The questionnaires were sent to patients who had collected medication during the current year and had given prior consent for information to be sent to them by e-mail.
Patient opinion was assessed using a Likert-type scale with 6 closed response items (0 = strongly disagree and 5 = strongly agree). Patients were asked to rate the following aspects: location/ease of access to the Pharmacy Service, convenience of opening hours, waiting times, waiting room conditions, respect for privacy, and care and service provided. Patients were also asked to rate consultations with pharmacists regarding accessibility, politeness, the usefulness of the information given, and whether they considered that they had been given all the information they needed about their treatment.
The questionnaires also included an item on overall satisfaction and an open question inviting patients to make suggestions or comments on the service provided. The questionnaires were managed using the Lime Survey application.
Quality indicatorWaiting time was defined as the main quality indicator. The initial results showed that 30% of patients waited for more than 30 minutes to be seen. The waiting room only had 10 seats and was overcrowded (> 10 patients) for more than 70% of the time. The team's improvement targets were to have less than 5% of patients waiting for over 30 minutes and to have all patients able to sit in suitable conditions while waiting.
Waiting times were measured using the Qmatic queue manager (preintervention period) and the Plexus appointment manager (post-intervention period). The data was collected automatically by measuring the time difference between patients collecting a ticket and being called for consultation.
Study periodThe definition, measurement, and analysis phases were conducted in the second half of 2018. The improvement actions were implemented progressively throughout the second half of 2019 and the first half of 2020. The waiting-time indicator was measured on a monthly basis from the start of the project. Patient satisfaction was measured through satisfaction questionnaires sent via email in December 2019 (before the main improvements) and in December 2020.
Statistical analysisAll statistical analyses were conducted using SPSS 20.0 (Chicago, USA). The questionnaire items were assessed on an ordinal numerical scale and considered as quantitative variables. Their distribution and dispersion measures (mean and standard deviation) were calculated. Homogeneity tests were used to assess differences using a P value of < .05 as a cutoff for statistical significance.
ResultsSix patients attended the focus group meeting out of the 12 patients who were originally invited (50%). The 3 women and 3 men were aged between 35 and 57 years. Three of them were receiving antiretroviral therapy and the other 3 were receiving cancer therapy.
The participants gave positive assessments of the information they received about treatment, both in person and by telephone. However, it was noted that not all the patients received adequate written information on logistic and organisational aspects and this led to interruptions. All the participants strongly appreciated the quality of service.
The main issues reported by the focus group were waiting times and the physical space itself. The group thought that the following issues should be prioritised: avoiding the transport of goods through routes shared with patients, dealing with the backlog of patients in the middle of the day, and improving conditions in the waiting room.
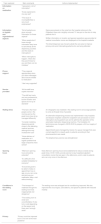
More than 30 improvement actions were identified by the multidisciplinary team and patient focus group. Of these 30, 9 improvement actions were prioritised, which were mainly related to structural and circuit changes. Table 1 shows the topics covered by the focus group, the main comments from patients, and the main improvement actions that were proposed by the work group based on Lean Methodology.
Topics explored, main comments, and actions implemented in the outpatient area
| Topic explored | Main comments | Actions implemented |
|---|---|---|
| Information on medication |
| |
| Information on logistic and organisational aspects |
|
|
| Phone support |
| |
| Service provided |
| |
| Waiting times |
|
|
| Opening hours |
| New afternoon opening hours were established to reduce crowds during peak times (10:00-14:00), provide service to day hospitals/outpatient consultation rooms that are open in the afternoons, and to cater to patients who can only come in the afternoon |
| Conditions in the waiting room |
| The waiting room was enlarged and air conditioning improved. We also improved the circuit signs, care stations, and space for patients with reduced mobility |
| Privacy | “Privacy could be improved but it is not one of the main problems” |
These actions were implemented progressively. In some cases, this process took more than one year because it required the collaboration of external services such as those related to Infrastructures and Information Systems.
Waiting times were significantly improved by these actions. The percentage of patients waiting for more than 30 minutes fell from 30% before improvements to 4.5% after improvements. Figure 1 shows the evolution of pre- and post-implantation waiting times.
.")
All patients can now sit while waiting and can do so in better conditions. This target was achieved by enlarging the waiting area and improving the air-conditioning system.
Table 2 summarises the results of the questionnaires on patient satisfaction sent out in 2019 and 2020.
Results of the satisfaction surveys and patients' scores
| 2019 | 2020 | |
|---|---|---|
| Surveys sent (n) | 4,749 | 5,048 |
| Surveys returned (n) | 1,723 | 1,564 |
| Surveys with comments (acknowledgements, complaints, suggestions) (n) | 661 | 579 |
| Men, (%) | 63% | 62% |
| Age > 65 years, (%) | 12.5% | 12.3% |
| Factors assessed | MEAN ± SD* | MEAN ± SD* | |
|---|---|---|---|
| Location/Ease of access | 3.6 ± 1.3 | 3.6 ± 1.9 | p > 0.05 |
| Opening times | 4.1 ± 1.1 | 4.2 ± 1.2 | p > 0.05 |
| Waiting times | 3.0 ± 1.5 | 3.3 ± 1.9 | p < 0.05 |
| Condition of the waiting room | 2.6 ± 2.3 | 2.6 ± 2.4 | p > 0.05 |
| Privacy | 3.9 ± 1.9 | 3.9 ± 2.1 | p > 0.05 |
| Care and service provided | 4.7 ± 0.6 | 4.8 ± 0.3 | p > 0.05 |
| Access to the pharmacist | 4.5 ± 0.8 | 4.6 ± 0.6 | p > 0.05 |
| Politeness (Pharmacist) | 4.8 ± 0.6 | 4.8 ± 0.3 | p > 0.05 |
| Usefulness of information given | 4.7 ± 0.7 | 4.7 ± 0.4 | p > 0.05 |
| Completeness of information given | 4.6 ± 0.8 | 4.6 ± 0.5 | p > 0.05 |
| Global satisfaction | 4.1 ± 0.9 | 4.3 ± 0.7 | p < 0.05 |
SD: standard deviation.
Significant differences were found in waiting times and overall satisfaction between the two periods. In both cases the satisfaction scores were higher in the second survey.
Figure 2 shows the suggestions provided by the patients in the satisfaction questionnaires. Both surveys showed that the most frequent comment was to thank the staff for their kindness and professionalism, followed by requests for better conditions in the waiting room. After the improvement actions were implemented, the most significant change was fewer complaints about long waiting times.
Discussion.")
The implementation of improvement actions should involve all health care staff who form part of the dispensing and pharmaceutical care process and should be based on an understanding of the patients’ experiences of the Outpatient Area.
We used several Lean Methodology tools to analyse the processes in depth and to identify and implement the most appropriate improvement actions in our Outpatient Area, while ensuring all staff were involved.
Lean Methodology has been used to improve different areas of hospital pharmacy5-13, but very few studies have addressed the dispensing process and outpatient pharmaceutical care.
The two approaches (focus group and satisfaction questionnaires) allowed us to obtain a great deal of information on the patients’ opinions and to identify the weak points of the service from patients’ perspective.
The results from the focus group and the satisfaction questionnaires were similar: the highest-rated aspects were the care and service provided, whereas the worst-rated aspects were the state of the waiting room, waiting times, location, and privacy.
These results are very similar to those of surveys conducted in other hospitals14-17. However, it should be noted that most of these studies used a 5-point Likert scale (1 to 5) whereas we used a 6-point Likert scale (0 to 5). This means that there was no neutral response and patients had to choose one way or the other.
The implementation of the improvement actions improved the patients’ assessment of waiting times and therefore overall satisfaction. However, the first survey showed that overall satisfaction was already acceptable. This is likely due to our patients’ positive assessment of the quality of the pharmaceutical care received, because this factor has the strongest correlation with patient satisfaction18.
The results of the focus group and surveys showed that satisfaction with service was very high, but that there were aspects that did not meet the patients’ expectations. Hospital management needs to be aware of the perspectives of patients receiving health care and to be involved in any improvements needed. Their approval is required for improving the area's facilities, obtain better IT resources, and extend opening hours and staffing levels.
The worst-rated aspects reported by other hospitals are similar to ours, such as waiting room conditions and waiting times15-17,19-21. Many hospitals have experienced growth in the number of patients, but this has not been matched by equivalent growth in outpatient areas. Resources should be adapted not only to dispensing but also to providing pharmaceutical care according to the CMO (capacity-motivation-opportunity) model22-24.
One of the limitations of this study is that the satisfaction questionnaire used was not validated because we had to adapt the questionnaire to our needs. The EVASAF25 scale is a validated questionnaire, but it only assesses pharmaceutical care received. In our case, we had to assess logistic aspects because the focus group had identified them as weak points in our service.
We were unable to implement some of the improvements requested by patients, such as moving the Pharmacy Service closer to the outpatient rooms or addressing the awkward location of the current waiting room. The size of the hospital makes it difficult to change the location of the specialty area. However, the suggestions of the patients who contributed to this study will be of great help in improving these aspects in redesigning the Pharmacy Service.
In any case, Outpatient Areas have changing needs and therefore continuous assessment is needed to identify any new opportunities for improvement that may arise over time.
We analysed the situation of our Outpatient Area and designed the most appropriate improvement actions according to the resources available. This initiative was achieved through patient participation (via focus group and mass surveys), the participation of health care staff, and the application of Lean Methodology.
This process has also helped with the internal organisation of the area and its future size in order to achieve maximum satisfaction among patients and the health care staff involved in the area.
FundingNo funding.
Conflict of interestNo conflict of interest.
Early Access date (09/22/2021).

