


To identify indicators of hospital use of antimicrobials from the benchmark analysis of consumption data between hospitals at the same level through the collective judgement of a group of experts.
MethodA committee formed by members of the Spanish Societies of Hospital Pharmacy and Infectious Diseases and Clinical Microbiology prepared a proposal of indicators which was submitted to consensus by a panel of 21 experts on infectious diseases, microbiology and antimicrobial therapy, through a modified Delphi method. The panel underwent two rounds of scores by e-mail. Participants assigned a score from 1 (completely disagree) to 9 (completely agree) to the relevance of each indicator in four dimensions: scientific evidence, efficacy and safety, ecological impact and cost. Scores were processed according to the RAND-UCLA method. An indicator was considered to be relevant if at least one dimension other than cost obtained a median score equal to or higher than 7 without disagreement among the panel.
ResultsThe committee submitted an initial proposal of 14 indicators. After the first round of panel scores, one indicator was ruled out and two were modified for moving on to the second round. Finally, 13 indicators were considered relevant.
ConclusionsDetermining indicators of the hospital use of antimicrobial agents based on consumption can allow the antimicrobial stewardship programs to detect any potential problems with the use of antimicrobial agents, and to help guide their efforts in order to implement actions of improvement, as well as to assess the impact of the measures implemented.
Identificar unos indicadores del uso hospitalario de antimicrobianos a partir del análisis comparativo de los datos de consumo entre hospitales del mismo nivel por medio del juicio colectivo de un grupo de expertos.
MétodoUn comité formado por miembros de la Sociedad Española de Farmacia Hospitalaria y de la Sociedad Española de Enfermedades Infecciosas y Microbiología Clínica preparó una propuesta de indicadores que fue sometida a consenso por un panel de 21 expertos en enfermedades infecciosas, microbiología y terapéutica antimicrobiana mediante un método Delphi modificado. El panel se sometió a dos rondas de puntuaciones por correo electrónico. Los participantes puntuaron de 1 (completamente en desacuerdo) a 9 (completamente de acuerdo) la relevancia de cada indicador en cuatro dimensiones: evidencia científica, eficacia y seguridad, repercusión ecológica y coste. Las puntuaciones fueron procesadas según el método UCLA-RAND. Un indicador fue juzgado como relevante si al menos una dimensión distinta al coste obtenía una mediana de puntuación igual o superior a 7 sin haber desacuerdo entre el panel.
ResultadosEl comité planteó una propuesta inicial de 14 indicadores. Tras la primera ronda de puntuaciones del panel, un indicador fue desestimado y dos fueron modificados para el paso a la segunda ronda. Finalmente, 13 indicadores fueron considerados relevantes.
ConclusionesEl establecimiento de indicadores del uso hospitalario de antimicrobianos basados en el consumo puede permitir a los programas de optimización de antimicrobianos detectar cuáles son los problemas potenciales de uso de los antimicrobianos, y ayudar a orientar sus esfuerzos para emprender acciones de mejora, así como para valorar el impacto de las medidas efectuadas.
Antimicrobial stewardships (AMS) programs are being progressively implemented in our hospitals. Their objectives are to improve clinical results, reduce those adverse effects associated with the use of antibiotics, including resistance, and guarantee a cost-effective therapy1,2.
One of the main needs of AMS programs is to define indicators to measure the impact of their implementation. Among the indicators proposed to monitor the development of hospital AMS programs, there are structure indicators that describe the organization, composition, resources and tools necessary to carry out the necessary activities3–6.
In order to meet the objectives of the AMS programs, indicators of clinical results have been developed, such as the reduction in the incidence of Clostridium difficile infection7, as well as for the mortality and hospital stay in selected infections8. Indicators for ecological results have also been proposed, shown as the reduction in the rates of bacterial resistance to antibiotics8,9. These indicators are undoubtedly necessary, but difficult to evaluate, because their results are multifactorial variables without any direct or immediate link with an adequate use of antimicrobial agents.
On the other hand, process indicators have been defined, for example to measure the quality of use of antimicrobial agents in hospitals; their methodology is based on audits or prevalence surveys4,10. However, their use is limited by the intensive labour, and the lack of homogeneity in the evaluation of prescription in critical aspects such as the evaluating staff, sample selection, parameters to be considered and their relative weight, and the degree of adaptation of each parameter11–13. This leads to a high heterogeneity in the method and the results, and a significant burden of subjectivity and variability between observers in the final evaluation12,13.
Monitoring the use of antimicrobial agents is one of the activities described in the AMS programs. Its role is to detect points susceptible to improvement actions and to evaluate the impact of interventions through the comparison between hospitals of the same level, and the analysis of time series in a single center, as well as to be used as support for the study of ecological impact1,2.
Unlike the Primary Care setting, where the Spanish National Plan against Antibiotic Resistance (PRAN)14 and the European Center for Disease Prevention and Control (ECDC)15 have established indicators for the quality of use of antibiotics, these indicators have not been defined in the hospital setting.
The objective of this project was to identify some indicators of the use of antimicrobial agents in hospitals, through the comparative analysis of consumption data between hospitals of the same level, by the collective judgment of a group of experts.
MethodsA study was designed to identify indicators of the use of antimicrobial agents in hospitals, based on the comparative analysis of the consumption in hospitals of the same level, through the consensus of the group of experts following a modified Delphi methodology.
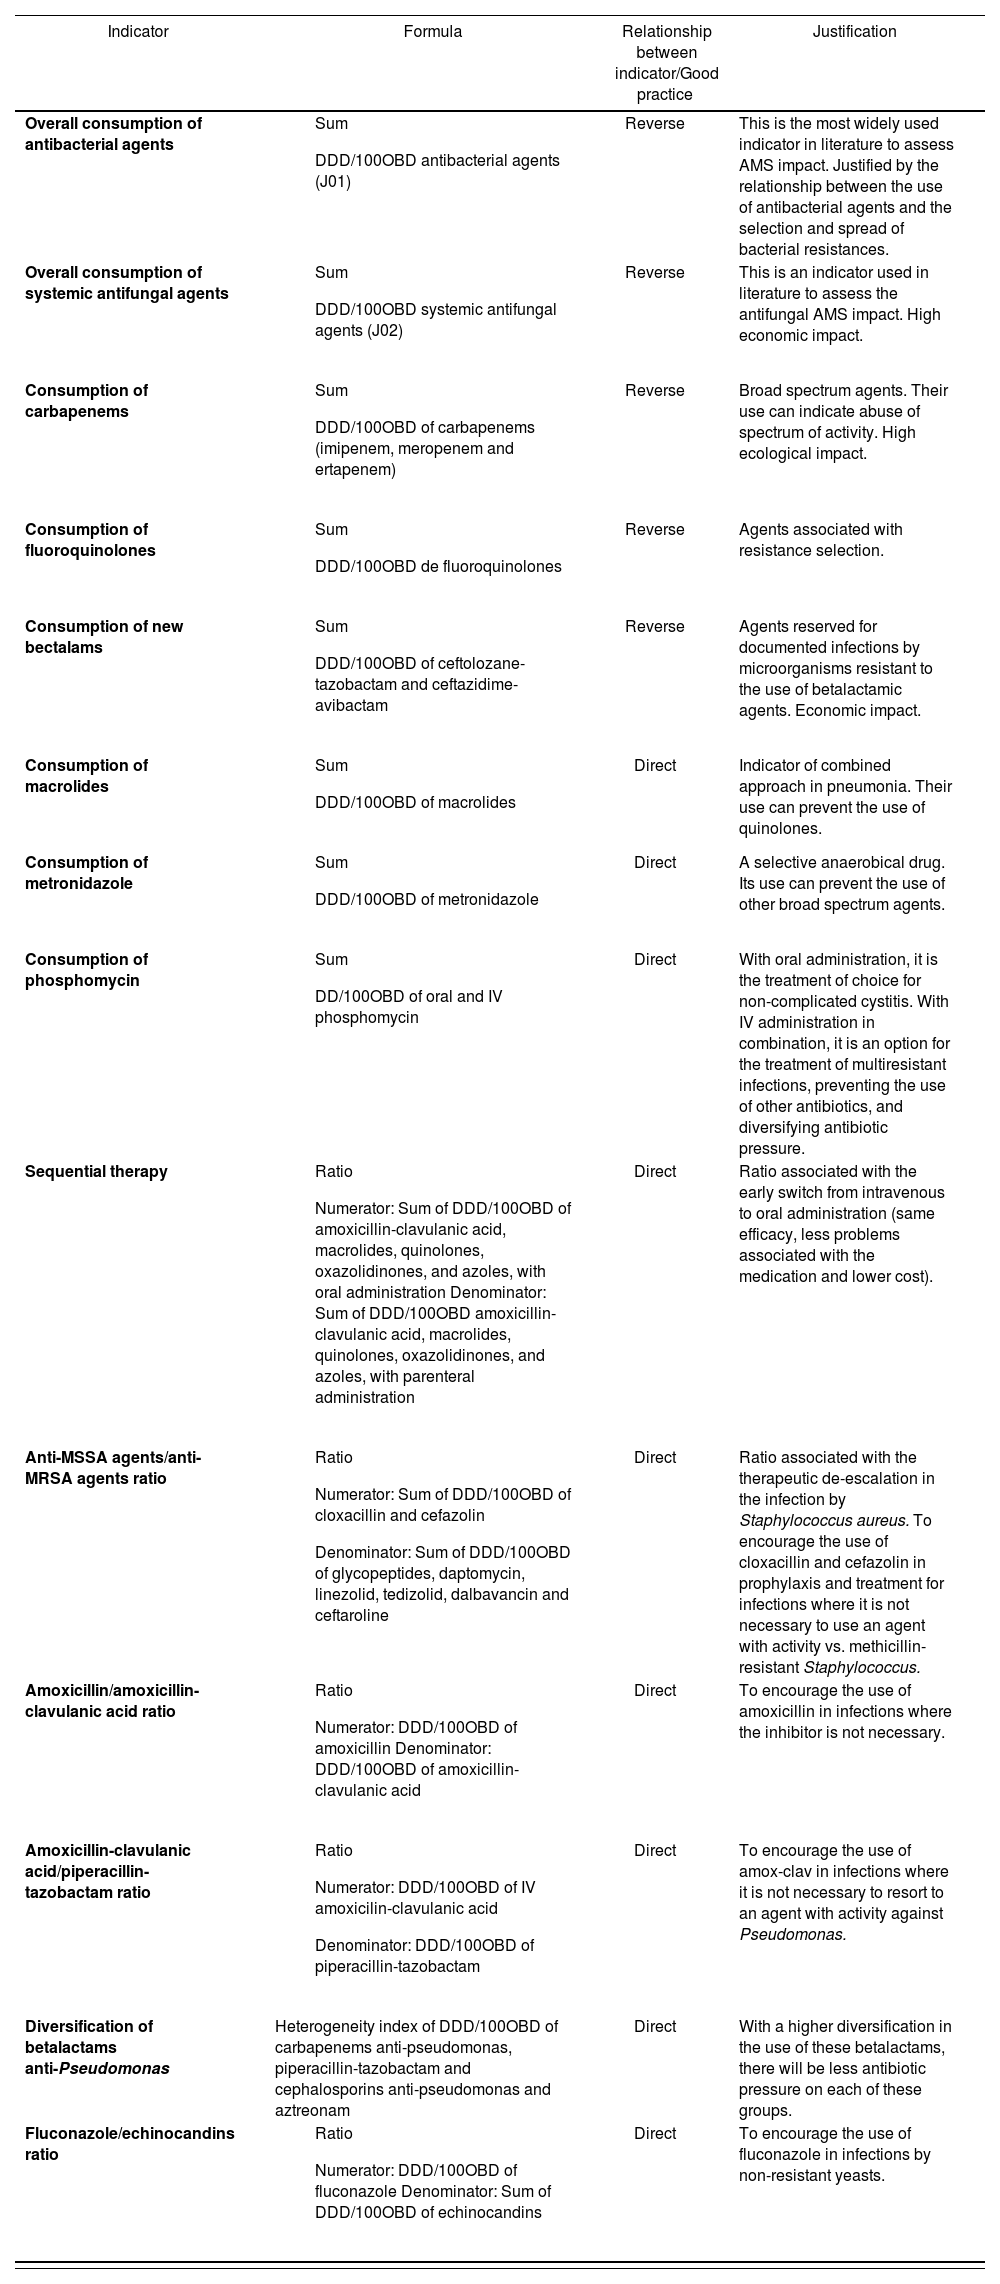
The development of the study is outlined in Figure 1. Initially, a coordinating committee, formed by the authors of this document, supported by the Group of Pharmacy Care for Infectious Diseases of the Spanish Society of Hospital Pharmacy (SEFH) and the Group for Healthcare-Related Infectious Diseases of the Spanish Society of Infectious Diseases and Clinical Microbiology, prepared a proposal of indicators based on their knowledge, experience, and literature review, considering criteria of efficacy, safety, ecological impact and cost (Table 1).

Indicators initially proposed by the Coordinating Committee
| Indicator | Formula | Relationship between indicator/Good practice | Justification |
|---|---|---|---|
| Overall consumption of antibacterial agents |
| Reverse | This is the most widely used indicator in literature to assess AMS impact. Justified by the relationship between the use of antibacterial agents and the selection and spread of bacterial resistances. |
| Overall consumption of systemic antifungal agents |
| Reverse | This is an indicator used in literature to assess the antifungal AMS impact. High economic impact. |
| Consumption of carbapenems |
| Reverse | Broad spectrum agents. Their use can indicate abuse of spectrum of activity. High ecological impact. |
| Consumption of fluoroquinolones |
| Reverse | Agents associated with resistance selection. |
| Consumption of new bectalams |
| Reverse | Agents reserved for documented infections by microorganisms resistant to the use of betalactamic agents. Economic impact. |
| Consumption of macrolides |
| Direct | Indicator of combined approach in pneumonia. Their use can prevent the use of quinolones. |
| Consumption of metronidazole |
| Direct | A selective anaerobical drug. Its use can prevent the use of other broad spectrum agents. |
| Consumption of phosphomycin |
| Direct | With oral administration, it is the treatment of choice for non-complicated cystitis. With IV administration in combination, it is an option for the treatment of multiresistant infections, preventing the use of other antibiotics, and diversifying antibiotic pressure. |
| Sequential therapy |
| Direct | Ratio associated with the early switch from intravenous to oral administration (same efficacy, less problems associated with the medication and lower cost). |
| Anti-MSSA agents/anti-MRSA agents ratio |
| Direct | Ratio associated with the therapeutic de-escalation in the infection by Staphylococcus aureus. To encourage the use of cloxacillin and cefazolin in prophylaxis and treatment for infections where it is not necessary to use an agent with activity vs. methicillin-resistant Staphylococcus. |
| Amoxicillin/amoxicillin-clavulanic acid ratio |
| Direct | To encourage the use of amoxicillin in infections where the inhibitor is not necessary. |
| Amoxicillin-clavulanic acid/piperacillin-tazobactam ratio |
| Direct | To encourage the use of amox-clav in infections where it is not necessary to resort to an agent with activity against Pseudomonas. |
| Diversification of betalactams anti-Pseudomonas | Heterogeneity index of DDD/100OBD of carbapenems anti-pseudomonas, piperacillin-tazobactam and cephalosporins anti-pseudomonas and aztreonam | Direct | With a higher diversification in the use of these betalactams, there will be less antibiotic pressure on each of these groups. |
| Fluconazole/echinocandins ratio |
| Direct | To encourage the use of fluconazole in infections by non-resistant yeasts. |
AMS: antimicrobial stewardship; DDD/100OBD: number of defined daily dose per 100 occupied bed days; IV: intravenous; MRSA: methicillin-resistant Staphylococcus aureus; MSSA: methicillin-susceptible Staphylococcus aureus.
These indicators were defined using as source the data for hospital use of systemic antimicrobial agents, added by substance and administration route, according to the Anatomical Therapeutical Chemical Classification System and expressed in Defined Daily Dose (DDD) per each 100 occupied beds days (DDD/100OBD)16. The indicators have no established standard, but will acquire value through the comparison with hospitals of the same level.
Subsequently, the coordinating committee selected a panel of 21 Spanish experts with confirmed experience in the area of microbiology, infectious diseases, and antimicrobial therapy, formed by seven microbiologists, seven clinicians from infectious disease units, and seven hospital pharmacists who accepted to participate so that the proposed indicators would be submitted for their consideration. The board members are mentioned in the Acknowledgement section.
The RAND/UCLA method was used, which combines the Delphi and the Nominal Group techniques. This method consists in two evaluation rounds: the first one is conducted independently by each panel participant, and the second one in a face-to-face meeting17. In this study, the face-to-face meeting in the second round was replaced by a new individual evaluation.
The panel of experts was requested to qualify the relevance of each proposed indicator in four dimensions: Scientific evidence, efficacy and safety for patients, increase in microbial resistances, and cost for the health system.
The experts underwent two scoring rounds of a questionnaire sent by e-mail. There was a 1-to-9 scale, where 1 meant complete disagreement, 9 meant complete agreement, and 5 meant that it was uncertain.
In the first round, the panel of experts received the relevant bibliography and a questionnaire with the list of indicators, the definition of each, the formula for its calculation, and its justification for being proposed. The experts scored individually each one of the dimensions for the indicators. The experts were also encouraged to make comments about each indicator.
The coordinating committee evaluated the scores and comments by the panel, and prepared a second questionnaire, where the indicators were kept, modified or removed according to the first round scores, and issued an analysis of the results for each indicator in order to increase the elements of judgment for the experts.
In the second round, the modified questionnaire was sent, which the experts scored again, aware of the median and range of the first round scores, as well as the comments provided anonymously by the panel members and the analysis by the committee. The objective of this round was to give the experts the chance to review again their own evaluation, now with information about the evaluation by the other participants.
The scores given by the panel of experts to each one of the dimensions of each indicator were analyzed according to the procedure suggested in the RAND/UCLA method17.
Each dimension was classified as adequate, inadequate or uncertain, based on the median scores by the members of the group, and the degree of disagreement (Table 2).
In order to define disagreement, the ratio between the Inter Percentile Range (IPR) and the Inter Percentile Range Adjusted per Symmetry (IPRAS) was used. An indicator was classified as with disagreement when the IPR was higher than the IPRAS. The IPR was calculated as the difference between the IPRAS = 2.35 + 1.5 · AI, where AI is the Asymmetry Index, which represents the distance between the IPR central point and the 5 value (central point in the scoring scale from 1 to 9)17.
The criterion to exclude an indicator to move on to the second round was that any indicator dimension was scored as inadequate.
The criterion to consider an indicator as relevant after the second round was that at least one dimension was scored as adequate, or at least 2 if one of them was cost, and that there were no dimensions scored as inadequate.
ResultsThe coordinating committee proposed a list of 14 potential indicators, based on the scientific evidence available, and on the experience and knowledge by the members of the committee (Table 1).Table 1 shows the description of each indicator, as well as the formula for its calculation, its direct or reverse relationship with good practice, and the justification for its proposal.
After the first round of scores, answered by the 21 participants of the panel of experts, the indicator for use of new bectalam agents was excluded, because it did not reach the sufficient criterion to move on to the second round. It obtained a median score of 8 in the cost dimension, 5 in resistance impact, 4 in scientific evidence and 3 in efficacy and safety. The majority of panel participants considered that the consumption of new bectalams could not be evaluated without considering the microbiological pattern of the hospital. Likewise, some members estimated that its low consumption could not be always considered good practice, and could even indicate excessive restriction causing clinical damage to patients, by not using the most adequate option. The rest of indicators obtained scores sufficient to move on to the second round.
The analysis by the committee of the comments and scores by the panel of experts in the first round led to the modification of two indicators for the second round: The macrolide consumption indicator was replaced by the ratio between the consumption of intravenous macrolides and intravenous respiratory fluoroquinolones, and the metronidazole consumption indicator was replaced by the ratio between the consumption of metronidazole and the sum of the consumption of carbapenems + piperacillin/tazobactam. The opinions of some board members, and the subsequent reflection by the committee, led to consider that the new definition of these two indicators showed their objectives in a better way.
After the second round, answered by all panel members, the indicators proposed reached the level of relevance according to the established criteria. Board members scored two indicators with the four dimensions as adequate, five indicators with three adequate dimensions, four indicators with two adequate dimensions, and two indicators with one dimension, different to cost, scored as adequate (Table 3).
Results after the second round
| Indicator | Dimension | Scores | Degree of disagreement | Adequate | ||
|---|---|---|---|---|---|---|
| Median | Min | Max | ||||
| Overall consumption of antibacterial agents | Scientific evidence | 6 | 4 | 8 | No disagreement | Uncertain |
| Efficacy and safety | 6 | 4 | 8 | No disagreement | Uncertain | |
| Impact of resistance | 8 | 7 | 9 | No disagreement | Yes | |
| Cost | 8 | 6 | 9 | No disagreement | Yes | |
| Overall consumption of systemic antifungal agents | Scientific evidence | 6 | 5 | 8 | No disagreement | Uncertain |
| Efficacy and safety | 6 | 4 | 7 | No disagreement | Uncertain | |
| Impact of resistance | 7 | 5 | 9 | No disagreement | Yes | |
| Cost | 9 | 7 | 9 | No disagreement | Yes | |
| Consumption of carbapenems | Scientific evidence | 7 | 5 | 9 | No disagreement | Yes |
|
|
|
|
|
| |
| Cost | 7 | 4 | 9 | No disagreement | Yes | |
| Consumption of fluoroquinolones | Scientific evidence | 7 | 4 | 9 | No disagreement | Yes |
| Efficacy and safety | 7 | 4 | 9 | No disagreement | Yes | |
| Impact of resistance | 9 | 7 | 9 | No disagreement | Yes | |
| Cost | 6 | 3 | 8 | No disagreement | Uncertain | |
| Intravenous macrolides/Intravenous respiratory fluoroquinolones ratio | Scientific evidence | 6 | 3 | 9 | No disagreement | Uncertain |
| Efficacy and safety | 5 | 3 | 9 | No disagreement | Uncertain | |
| Impact of resistance | 7 | 5 | 9 | No disagreement | Yes | |
| Cost | 5 | 2 | 8 | No disagreement | Uncertain | |
| Metronidazole/piperacillin-tazobactan + carbapenem ratio | Scientific evidence | 6 | 4 | 9 | No disagreement | Uncertain |
| Efficacy and safety | 6 | 5 | 9 | No disagreement | Uncertain | |
| Impact of resistance | 7 | 5 | 9 | No disagreement | Yes | |
| Cost | 7 | 2 | 9 | No disagreement | Yes | |
| Consumption of phosphomycin | Scientific evidence | 5 | 2 | 8 | No disagreement | Uncertain |
|
|
|
|
|
| |
| Cost | 7 | 3 | 9 | No disagreement | Yes | |
| Sequential therapy | Scientific evidence | 8 | 5 | 9 | No disagreement | Yes |
| Efficacy and safety | 8 | 7 | 9 | No disagreement | Yes | |
| Impact of resistance | 5 | 1 | 9 | No disagreement | Uncertain | |
| Cost | 8 | 4 | 9 | No disagreement | Yes | |
| Anti-MSSA agents/anti-MRSA agents ratio | Scientific evidence | 8 | 4 | 9 | No disagreement | Yes |
| Efficacy and safety | 8 | 4 | 9 | No disagreement | Yes | |
| Impact of resistance | 6 | 2 | 9 | No disagreement | Uncertain | |
| Cost | 9 | 2 | 9 | No disagreement | Yes | |
| Amoxicillin/amoxicillin-clavulanic acid ratio | Scientific evidence | 7 | 4 | 9 | No disagreement | Yes |
| Efficacy and safety | 8 | 4 | 9 | No disagreement | Yes | |
| Impact of resistance | 8 | 4 | 9 | No disagreement | Yes | |
| Cost | 7 | 2 | 9 | No disagreement | Yes | |
| Amoxicillin-clavulanic acid/piperacillin-tazobactam ratio | Scientific evidence | 6 | 3 | 8 | No disagreement | Uncertain |
| Efficacy and safety | 7 | 3 | 8 | No disagreement | Yes | |
| Impact of resistance | 7 | 4 | 9 | No disagreement | Yes | |
| Cost | 7 | 2 | 9 | No disagreement | Yes | |
| Diversification of betalactams anti-Pseudfomonas | Scientific evidence | 5 | 4 | 9 | No disagreement | Uncertain |
| Efficacy and safety | 5 | 4 | 7 | No disagreement | Uncertain | |
| Impact of resistance | 7 | 4 | 8 | No disagreement | Yes | |
| Cost | 5 | 2 | 9 | No disagreement | Uncertain | |
| Fluconazole/echinocandins ratio | Scientific evidence | 7 | 6 | 9 | No disagreement | Yes |
| Efficacy and safety | 7 | 5 | 8 | No disagreement | Yes | |
| Impact of resistance | 6 | 4 | 9 | No disagreement | Uncertain | |
| Cost | 9 | 7 | 9 | No disagreement | Yes | |
MRSA: methicillin-resistant Staphylococcus aureus; MSSA: methicillin-susceptible Staphylococcus aureus.
We haven't found any publication in literature establishing a set of indicators that allow to reach conclusions about the quality of the hospital use of antibiotics, exclusively based on consumption data.
All process indicators that evaluate the quality of use of antimicrobial agents in the hospital setting are based on specific prescription evaluations, which are cumbersome to conduct, with non-standard design and method, and with results depending on the criterion by the evaluator.
This study offers a new method to measure a series of good practices in the hospital use of antimicrobial agents based on a photograph of consumption, and by comparison between similar hospitals.
In the setting of primary care, and by using consensus methods, there has been a determination of indicators of the use of antibiotics based on consumption at national14 and European15 level. In both cases, there is no standard of reference for the indicators established, but these acquire value by comparison with the data from other geographical areas.
In a similar manner to the initiatives mentioned in primary care, the indicators in our study draw upon the comparative analysis of the consumption data from hospitals of the same level. The more representative and reliable the consumption data are, and the higher the homogeneity by the portfolio of services and ecological pattern between hospitals compared, the more robust the results obtained.
The selection of indicators was based on prioritizing the consumption of the agents of choice in the main infections described in guidelines and protocols of reference, on reducing the use of antimicrobial agents in general, and of those with broad spectrum in particular, due to the impact on selection and spread of resistances, as well as on the application of measures for therapeutic adaptation and simplification, such as de-escalation strategy that replace empiric treatment by the narrowest possible spectrum agent, or the sequential therapy with the switch from intravenous to oral administration.
There is enough evidence proving that the reduction in the use of antimicrobial agents, particularly those with broader spectrum, will offer benefits for the health system, such as savings in direct costs and the potential reduction in microbial resistances, without affecting the clinical course of patients8,9,18,19. The benefit in the application of de-escalation practices20,21 and sequential therapy22,23 has also been documented.
Our study has various limitations. The indicators selected were developed by consensus from a multidisciplinary panel of professionals, clinicians who are expert in infectious diseases, microbiologists and hospital pharmacists. Even though this structure is considered optimal for the development of antibiotic policies in hospital care, it only shows the subjective opinion and knowledge by a group of experts, without objective validation or confirmed scientific evidence. The use of multicriteria decision analysis for scoring the quality indicators can also be questionable, but this strategy is necessary in order to address the different dimensions in the evaluation of antimicrobial use.
However, the greatest limitation concerns the definition itself of the indicators, and the fact that these depend exclusively on consumption data. Numerous omments by panel members about various indicators referred to the need of complementing the antimicrobial consumption data with the local pattern of microbial resistances, the portfolio of services by each hospital, and the clinical results obtained, regardless of conducting the comparison between hospitals with the same level of complexity.
Even though these indicators have no absolute reliability in order to measure the quality of use of antimicrobial agents, and require individual interpretations of the results in each case, according to the particular characteristics of each hospital, these indicators are necessary, because it is required to measure the use of antimicrobial agents, they are feasible because they are easy to implement, and objective because they are not dependent on the subjective evaluation of an observer.
The indicators defined will be incorporated to the platform in the SEFH website, for entering antimicrobial consumption data based on pharmacy unit dispensing. The centers which enter their consumption data voluntarily will have access to the information about the relative value of the indicators. The analysis of the results of the indicators during the next years will be used for their validation and to confirm their utility.
The information provided by applying the indicators can be very useful in order to allow hospital AMS teams to detect any potential problems with the use of antimicrobial agents, and to help guide their efforts to implement actions of improvement, as well as to value the impact of the measures conducted.
FundingNo funding.
AcknowledgementsMembers of the Expert Panel:
María Ángeles Allende Bandrés. Pharmacist. Zaragoza.
Pilar Aznarte Padial. Pharmacist. Granada.
Germán Bou Arévalo. Microbiologist. La Coruña.
Esther Calbo Sebastián. Infectious Diseases. Barcelona.
Emilia Cercenado Mansilla. Microbiologist. Madrid.
José Miguel Cisneros Herreros. Infectious Diseases. Seville.
Javier Cobo Reinoso. Infectious Diseases. Madrid.
Sara Cobo Sacristán. Pharmacist. Barcelona.
Olga Delgado Sánchez. Pharmacist. Palma de Mallorca.
Marcelo Domínguez Cantero. Pharmacist. Pamplona.
Santiago Grau Cerrato. Pharmacist. Barcelona.
José Antonio Lepe Jiménez. Microbiologist. Sevilla.
Lorena López Cerero. Microbiologist. Sevilla.
Pedro Llinares Mondéjar. Infectious Diseases. La Coruña.
Lurdes Matas Andreu. Microbiologist. Barcelona.
Luis Martínez Martínez. Mcirobiologist. Córdoba.
Jordi Nicolás Picó. Pharmacist. Barcelona.
Antonio Oliver Palomo. Microbiologist. Palma de Mallorca.
Maite Pérez Rodríguez. Infectious Diseases. Vigo.
José Luis del Pozo León. Infectious Diseases. Pamplona.
Pilar Retamar Gentil. Infectious Diseases. Seville.
Conflict of interestsNo conflict of interests.
Contribution to the scientific literature
This study identifies some indicators of the hospital use of antimicrobial agents based on the comparative analysis of the consumption in hospitals of the same level.
These indicators will allow the hospital AMS teams to guide their efforts in order to implement actions for improvement and measure the impact of their interventions.

