


To analyze the results of sentinel patient program to monitoring the quality pharmacoterapeutic process in the hospitalized patient through medication errors.
MethodDesign: Observational, prospective and transversal study. Ambit: General hospital of 1,000 beds. Period: From May 2011 to June 2016. Sample: Patients with treatment prescribe within 24 hours of being admitted with 4 or more medications. Variables: Medication error, drugs prescribed, medications and doses dispensing, drugs administered. Safety indicators were defined based on medication errors at each stage of the pharmacotherapeutic process.
ResultsOf the 746 patients studied, 334 had at least 1 medication error (44.8%; IC95%: 41.7-47.8). In the 746 treatments, 564 medication errors were detected (0.75 errors by patient; IC95%: 0.7-0.8). The safety indicators (medication error by stage) were: 5.1% (38/746 patients) for omission of allergy record; 2.3% (156/6 724 drugs) for prescription; 0.6% (38/6 724 drugs) for validation, 2.6% for dispensing (142/5 465 drugs) y 3.7% (190/5 111 administered drugs observed) for administration. The temporal evolution of the indicators, with graphs of statistical control showed stable processes, except for the administration. The proposed improvement actions were of a training, standardization and organizational type.
ConclusionsThe sentinel patient program provides an overview of the quality of the pharmacotherapeutic process and promotes the safety culture at the center. Statistical control charts have been a useful tool for monitoring medication errors. The analysis of medication errors has served to propose improvement actions in each stage of the pharmacotherapeutic process.
Analizar los resultados del programa paciente centinela para la monítorízacíón de la calidad del proceso farmacoterapéutico en el paciente hospitalizado mediante indicadores basados en errores de medicación.
MétodoDiseño: Estudio observacional, transversal y prospectivo. Ámbito: Hospital general de 1.000 camas. Periodo: mayo 2011-junio 2016. Muestra: Pacientes con cuatro o más medicamentos. Variables: Error de medicación, medicamentos prescritos, medicamentos y dosis preparadas, medicamentos administrados. Se definieron indicadores de seguridad a partir de los errores de medicación en cada fase del proceso farmacoterapéutico.
ResultadosDurante el periodo de estudio, 334 de 746 pacientes presentaron algún error, lo que supuso un 44,8% (IC95%: 41,7 a 47,8). Se detectaron 564 errores de medicación (0,75 errores por paciente; IC95%: 0,7 a 0,8). Los indicadores de seguridad (errores de medicación por fase): omisión de registro de alergia 5,1% (38/746 pacientes); prescripción 2,3% (156/6.724 medicamentos); validación 0,6% (38/6.724 medicamentos), preparación: 2,6% (142/5.465 medicamentos) y administración: 3,7% (190/5.111 administraciones observadas). La evolución temporal de los indicadores, con gráficos de control estadístico, mostró procesos estables, excepto para la fase de administración. Las acciones de mejora propuestas fueron de normalización, formación y organización.
ConclusionesEl programa paciente centinela proporciona una visión global de la calidad del proceso farmacoterapéutico y fomenta la cultura de seguridad en el centro. Los gráficos de control estadístico han sido una herramienta útil para monitorizar los errores de medicación. El análisis de los errores de medicación ha servido para plantear acciones de mejora en cada una de las fases del proceso farmacoterapéutico.
Beginning in the 1990s, epidemiological studies conducted in Spain have significantly improved our understanding of adverse events in healthcare1. In recent years, there have been many epidemiological studies on drug safety2–5. The Estudio Nacional sobre Efectos Adversos ligados a la Hospitalización (ENEAS) 2005 study found an incidence of adverse events related to medical errors in hospitalized inpatients of 9.3% (confidence interval of 95% [95%CI], 8.6%–10.1%). Of the total number of adverse events, 37.4% were related with medication, of which 34.8% were considered avoidable2. One study found that the prevalence of patients who experienced adverse effects in primary care was 10.11% (95%CI, 9.48%–10.74%), and that medication was involved in almost half (47.8%) of the cases3. Research on medication errors (i.e., preventable events) in Spain has found rates of 7% to 22%6,7.
These data show that drug safety is not only a major concern, but that almost 50% of adverse events are preventable2. Experts in patient safety have recommended the implementation of actions addressing the standardisation of processes and risk management8. Quality programs may be effective tools to improve risk management in the use of medication.
The hospital in which this study was conducted was transferred to a different location in 2011. This move involved structural and organizational changes that led the pharmacy service to implement a quality improvement project using the Lean Six Sigma method9. This project was the starting point to establish a program to assess the quality of the pharmacotherapeutic process in hospitalized inpatients, with the aim of implementing recommendations and improvement actions addressed to the staff and process managers.
The aim of the present study was to analyse the results of the sentinel patient program, which was established to monitor the quality of the pharmacotherapeutic process in hospitalized inpatients using medication error (ME) indicators.
MethodsEthical aspects: The sentinel patient program was authorized by the biomedical research committee of the hospital and by the medical and nursing management. The printed and electronic records excluded any data that could identify the patient.
Design: Observational prospective cross-sectional study. Study period: May 2011-June 2016.
Setting: General hospital with 1,000 beds: of these, 850 were included in an assisted electronic prescription system, 715 adult beds were included in a unit dose drug dispensing system, and 135 paediatric beds were included in a floor stock dispensing system.
Pharmacotherapeutic process: Integrated electronic assisted prescription software was used for medical prescription, pharmaceutical validation, and drug administration and drug administration record management. The pharmacy service prepared the medication carts for daily distribution using semi-automated dispensing cabinets connected to the prescription software.
Organization of the working group: A team of pharmacist observers selected the patients and reviewed each stage of the pharmacotherapeutic process to analyse its quality and detect MEs. Pharmacist evaluators trained the observers, updated the work protocol, and reviewed the collected data. The degree of agreement or concordance between observers and evaluators in the detection of MEs was assessed using the Cohen kappa coefficient applying the criteria of Landis and Koch. This analysis was conducted each time new observers were incorporated in the group. The degree of agreement or concordance had a mean value of 0.72 (good agreement).
Inclusion criteria: Patients with 4 or more medications within 24 hours of hospitalization, in a hospitalization unit with electronic prescription and unit dose drug dispensing systems.
Exclusion criteria: Patients admitted to critical care units, neonates, paediatric patients, and emergency patients according to the patient's care profile and the characteristics of the medication distribution system in these units. The analysis excluded intravenous fluid therapy without electrolytes and parenteral chemotherapy.
Sample and sampling: Sample size was calculated based on the assumption that 50% of patients would experience a ME at some stage of the pharmacotherapeutic process, using a confidence level of 95%, an error rate of 5% in the observation method, and a population size of 40,000 admissions over 12 months. To determine the sample size of opportunities for error at each stage of the pharmacotherapeutic process under evaluation (prescription, validation, preparation, and administration), we assumed an error rate of 10%, a confidence level of 95%, an error rate of 5% in the observation method, and a population size of 2 million drugs over 12 months. Sampling was performed from Monday to Thursday between 1:00 p.m. and 2:00 p.m., selecting 2 patients from the same hospitalization unit from the list of patients with prescribed and validated treatments.
Unit of analysis: Prescription and validation stages: drugs that were or should have been prescribed (opportunities for error in prescription and validation). Preparation stage: drugs and prepared doses, and drugs prescribed but not dispensed (opportunities for error in preparation). Administration stage: doses administered from 8:00 a.m. to 9:00 a.m. and doses prescribed but not administered (opportunities for error in administration).
Data source: Pharmacological treatment record, patient clinical history record, medication cart preparation record, and medication administration sheet.
Main variable: Medication errors (ME) defined as any incident in each stage of the pharmacotherapeutic process.
Error detection method: MEs in the prescription and pharmaceutical validation stages were identified through a review of the pharmacological treatment (reconciliation, adherence with protocols, and adjustment according to renal function, etc); MEs in the preparation stage were identified by reviewing pharmacy drawers in the pharmacy service; and MEs in the administration stage were identified by direct observation between 8:00 a.m. and 9:00 a.m. on the day after sampling. If the administration stage could not be observed (discharge, transfer to ICU/PACU), the case was excluded from analysis. MEs were classified according to their type and the stage of the pharmacotherapeutic process according to the updated recommendations of the Ruiz-Jarabo Working Group10.
Variables: number of drugs prescribed, number of medications and doses prepared, number of medication administrations observed, type of ME, cause of ME, and recommendations and improvement actions. Safety indicators for each stage of the pharmacotherapeutic process were expressed as the ratio between MEs and opportunities for error. Quality evaluation was conducted by comparison with a target value that was based on experience in the study setting and the literature consulted9,11,12.
Statistical analysis: Categorical variables are expressed as absolute frequencies and percentages with their confidence intervals of 95% (95%CI). Quantitative variables are expressed as measures of central tendency (mean or median based on the assumption of a normal distribution) and dispersion (standard deviation, interquartile range). The evolution of MEs in each stage were analysed using statistical control charts (proportions graphs). A P value of < .05 was used as a cutoff for statistical significance (95%CI). All statistical analyses of the data collected by the observers were performed using the free version of Minitab Statistical Software 17® (Minitab Inc, Pennsylvania, USA).
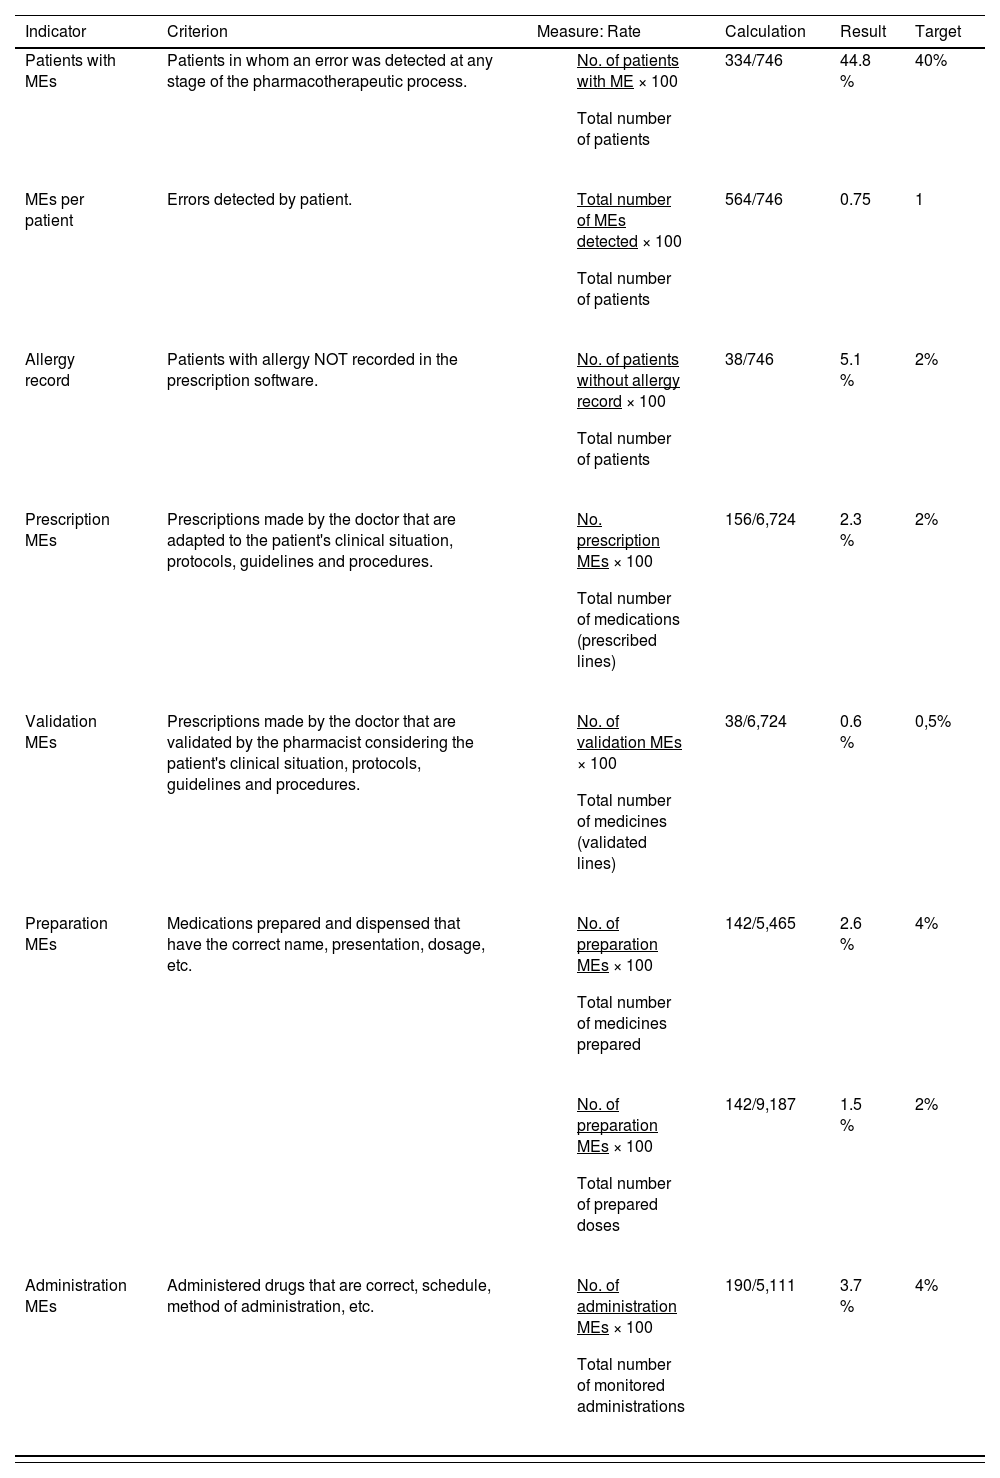
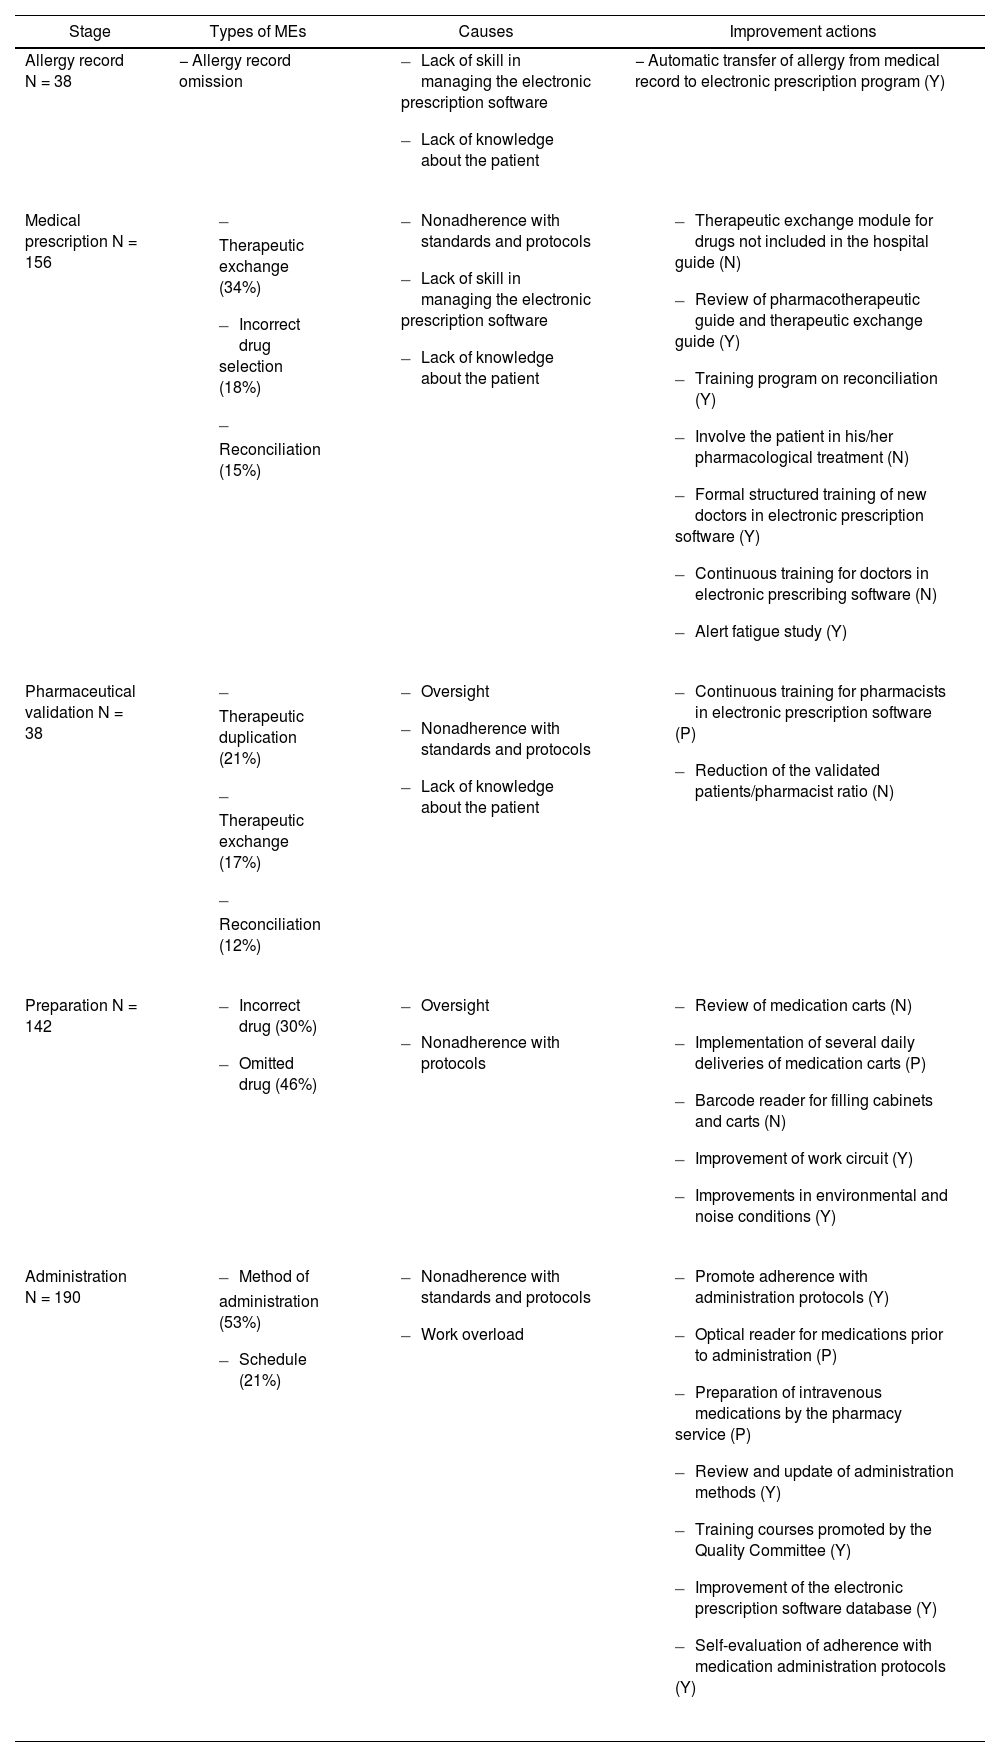
ResultsDuring the study period, 746 treatments corresponding to 746 patients were reviewed. In total, 6,724 prescribed drugs, 5,465 prepared medications, 9,187 prepared doses, and 5,111 drug administrations were analysed. The median number of drugs tested per treatment was 9 (standard deviation [SD] 3.4), the median number of prepared doses was 12.4 (SD 5.9), and the median number of observed drug administrations was 6.8 (SD 2.7) A total of 334 patients experienced an error (44.8% of the patients; 95%CI, 41.7%–47.8%). In total, 564 MEs were detected (0.75 errors per patient; 95%CI, 0.7%–0.8%). Table 1 shows the safety indicators used to assess the quality of the pharmacotherapeutic process with their corresponding target values. The percentage distribution of the 564 observed errors by stage of the pharmacotherapeutic process was as follows: prescription 27%, pharmaceutical validation 7%, preparation 25%, administration 33%. Omission of an allergy record in the electronic prescription software accounted for the remaining 7%. Figures 1 to 4 show the evolution of the security indicators over time. The members of staff associated with the detected MEs received verbal or written recommendations. In the case of prescription MEs, they received recommendations on standardization, training, and organization via the electronic prescription software. In addition, process managers and the hospital management (pharmacy service, nursing management, and medical management) received proposals on improvement actions. Table 2 shows the most frequently detected types of MEs, their causes, and the proposed improvement actions.
Safety indicators used in the different stages of the pharmacotherapeutic process.
| Indicator | Criterion | Measure: Rate | Calculation | Result | Target |
|---|---|---|---|---|---|
| Patients with MEs | Patients in whom an error was detected at any stage of the pharmacotherapeutic process. |
| 334/746 | 44.8 % | 40% |
| MEs per patient | Errors detected by patient. |
| 564/746 | 0.75 | 1 |
| Allergy record | Patients with allergy NOT recorded in the prescription software. |
| 38/746 | 5.1 % | 2% |
| Prescription MEs | Prescriptions made by the doctor that are adapted to the patient's clinical situation, protocols, guidelines and procedures. |
| 156/6,724 | 2.3 % | 2% |
| Validation MEs | Prescriptions made by the doctor that are validated by the pharmacist considering the patient's clinical situation, protocols, guidelines and procedures. |
| 38/6,724 | 0.6 % | 0,5% |
| Preparation MEs | Medications prepared and dispensed that have the correct name, presentation, dosage, etc. |
| 142/5,465 | 2.6 % | 4% |
| 142/9,187 | 1.5 % | 2% | ||
| Administration MEs | Administered drugs that are correct, schedule, method of administration, etc. |
| 190/5,111 | 3.7 % | 4% |
ME, medication error


Qualitative analysis of the most frequently detected MEs, their causes, and suggested improvement actions with their degree of implementation: Y (yes); N (no); P (partial implementation)
| Stage | Types of MEs | Causes | Improvement actions |
|---|---|---|---|
| Allergy record N = 38 | − Allergy record omission |
| − Automatic transfer of allergy from medical record to electronic prescription program (Y) |
| Medical prescription N = 156 |
|
|
|
| Pharmaceutical validation N = 38 |
|
|
|
| Preparation N = 142 |
|
|
|
| Administration N = 190 |
|
|
|
The sentinel patient quality control program allowed the detection of MEs, thus making it possible to monitor the quality of the pharmacotherapeutic process similar to the way in which an audit compares safety indicators with a target value and studies their variability over time.
Rather than using an epidemiological approach to investigate the prevalence of MEs, we applied a method that enabled us to assess the overall quality of the pharmacotherapeutic process by monitoring the different stages of the process in the same patient through the detection of MEs. In addition, the working group analysed the management and causes of MEs and also proposed improvement actions.
The results of this study are difficult to compare with those of other studies due to the use of different ME detection methods, differences in drug circuits, and the use of different ME classifications, among others. Blasco et al.13 conducted an observational prospective study applying a modified Barker-McConell observational method to study MEs. Although the results obtained by these authors are difficult to compare with those of the present study, the methods used in the 2 studies are very similar. These authors found a general rate of administration MEs of 12.8% (number of MEs to total opportunities for error) and 0.9 MEs per patient per day.
An observational study conducted in 6 hospitals in Catalonia recorded MEs per day in each stage of the pharmacotherapeutic process14. The study found a rate of 16.94 observed MEs per 100 patient-days. The highest ME rate (48%) was found in the preparation-dispensation stage. A possible explanation for this result is that drug preparation was performed manually in some of the case study hospitals14. However, in the present study, there was a higher degree of automation in the preparation stage, and the highest ME rate (33%) was found in the administration stage.
The error rate of omission of allergy record was higher than the target value of 2%. The proposed improvement actions not only addressed the human factor, but also addressed the modification of prescription software, such as record optimization, automatic memory dump, and mandatory record keeping, all of which were implemented in 2017.
The rate of errors in the prescription stage was 2.3%, which was very close to the target value. Even so, this value was higher than the value (0.9%) found in the same hospital in 200611. Electronic prescription systems can reduce dose errors, but other types of errors associated with this technology can appear that could affect the patient and cause harm, as pointed out by other authors15,16. A study conducted in British hospitals reported a prescription error rate of 8.8 MEs per 100 drugs, possibly because only 3 of the 20 participant hospitals used an electronic prescription system17. Two other studies conducted in hospitals with electronic prescription systems found a prescription error rate of 0.8 and 2.65 MEs per 100 prescriptions analysed, respectively18,19. These rates are similar to the rate reported in the present study. The most frequent MEs were lack of therapeutic exchange, incorrect drug selection, and reconciliation errors. The main causes of error at this stage were as follows: non-compliance with norms and protocols, lack of skill in the use of electronic prescription software, and the lack of knowledge about the patient. These results are in line those reported in the literature18,19.
There was a significant decrease in prescription errors over time from 7% at the initial stage of the study to 2.3% at the final stage of the study. This decrease may have been due to the implementation of several improvement actions over the study period. The update of the therapeutic exchange guide and the electronic prescription software database led to a decrease in incorrect drug selection. In 2014, the pharmacy service of our hospital conducted a study on alert fatigue with the aim of only retaining the relevant alert fields in the electronic prescription software20. Zenziper et al.21 described the implementation of a clinical decision-making support system within an electronic prescription system. To ensure effectiveness and minimize alert fatigue, they suggested that the system should be under constant review and adjusted to the needs of the clinical unit using it. Training and practice are key to improving safety in the use of electronic prescription software22,23. Clinical pharmacists are responsible for training new doctors in its use, although the structured training of staff doctors remains pending.
The rate of errors in the validation stage to the number of opportunities for error was 0.6%, which was very close to the target value. This stage of the pharmacotherapeutic process had the lowest rate of errors, probably due to the use of decision support modules integrated in the electronic prescription software (adjustment for renal failure, allergy record, maximum dose, security alerts, etc) to review medical prescriptions. The observed ME rate at this stage is difficult to compare to ME rates found in other studies because the majority of these studies included the transcription of treatment records from paper to digital format. This step is more prone to error. Even so, other studies have reported transcription-validation error rates of 1.6%11 and 0.82%14. Gorbach et al.23 analysed MEs caused by the pharmacist in the verification of pharmacological treatments, obtaining 4.87 MEs per 100,000 prescriptions. The profile of validation MEs and their causes were similar to those of prescription MEs, since most of the validation errors were prescription errors not detected by the pharmacist.
The evolution of validation errors remained stable over time, although the percentage of validation errors increased slightly in the final period of the study. This result was due to an increase in the number of services provided to patients, which involved an increase in the number of pharmaceutical validations, especially during on-call service hours.
The rates of errors in the drug preparation stage and dose preparation stage compared with the opportunity for error were 2.6% and 1.6%, respectively. Neither of these percentages exceeded the target value. A study was conducted at our hospital to monitor dispensing errors through the review and random tracking of medication carts.12 The rate of errors per drug prepared was 1.8%, which was slightly lower than the percentage found in the present work. Álvarez-Díaz et al.24 conducted a study in a 1070-bed general hospital with an electronic prescription and unit dose system, which was similar setting to that described in the present study. They found a preparation error rate of 2.2%, and suggested that the application of new technologies, particularly electronic prescription, may contribute to the reduction of MEs at this stage.
The statistical control charts showed that there had been a steady decrease in medication preparation errors from 4% at the beginning of the study to 2.5% at the end of the study. Since 2011, actions have been implemented to increase safety in this stage, such as changes in work rounds, improvements in environmental conditions, and reductions in noise levels.
The rate of errors in the administration stage was 3.7%, which was lower than the target value of 4%, but higher than the value of 2.1% found in a previous study11. It is important to note that the definition of administration error is very broad, covering aspects such as discrepancies in administration time, administration of the drug with or without food, identification of the patient prior to administration. Thus, different studies have reported error rates that range from 2% to 22%14,25,26. As reported in other studies25,27, the most frequent errors in the administration stage were administration method and timing errors. Timing errors may not be of clinical relevance in most cases, although delays in administration of specific drugs may cause adverse events or legal claims by the patient.
The rate of MEs in the administration stage not only decreased over the study period (6% at the beginning of the study and 3.7% at the end of the study), but also oscillated during the study period. This result may have been due to the difficulty of monitoring this stage and to the heterogeneity of working protocols at different hospitalization units. The observed improvement in MEs during this stage may have been due to the review and updating of administration methods in the electronic prescription software, and to staff training. The preparation of intravenous mixtures in the pharmacy service or the acquisition of ready-to-use medicines could reduce MEs associated with the dilution process, as well as shortening the time needed by ward nursing staff for medication preparation and administration.
One of the limitations of this study is the ME detection method used, which was based on review and direct monitoring. The staff involved in the study were aware that they were being monitored, and therefore may have modified their behaviour. In addition, issues concerning intra- and inter-observer reliability should be taken into account. Furthermore, the detection method used in this study and the selection of patients at admission may have favoured the detection of technical errors over the detection of therapeutic errors, leading to their underdetection. Finally, no data were collected on the characteristics of the staff (e.g., seniority or position) involved in the errors, and so it was not possible to analyse potential associations between these variables and the MEs observed.
In conclusion, use of the sentinel patient program provides a general overview of the quality of the pharmacotherapeutic process and promotes a safety culture in hospitals. Statistical control charts are useful tools for monitoring MEs. Following the analysis of MEs in our hospital, improvement actions have been proposed for each stage of the pharmacotherapeutic process.
FundingNo funding.
Acknowledgements:To the interning pharmacists for their participation in this study as observers, to the pharmacotherapists, the pharmacy nursing staff and inpatient unit staff for their collaboration, and to the hospital management team for their support in improving the medication use system.
Conflict of interestsNo conflict of interests.
Contribution to the scientific literature
This article presents a method to monitor the quality of the pharmacotherapeutic process using safety indicators. The method not only identifies medication errors, but also provides direct recommendations to the staff involved in the error in order to correct or prevent the error. Statistical control charts are used to analyse variability in the indicators at each stage of the process over time. Thus, points can be detected at which previously established quality specifications are not fulfilled. The continuous quality control program described in this study promotes a culture of safety at hospitals, and is a tool to promote improvement actions related to medication use.

