


Indication of personalized pharmacotherapy in oncologic patients is based on the selection of the optimal treatment (drugs, dosing, routes and methods of administration and duration) and on the most appropriate dosing method to achieve maximum antineoplastic efficacy, expressed in terms of remission or relapse-free time and acceptable toxicity for the patients. The aim of this study was to explore the contribution of therapeutic monitoring of plasma concentrations and of the application of the pharmacokinetic and pharmacodynamic information available for some widely used drugs to therapeutic personalization to the care of oncologic patients.
MethodA complete non-systematic literature review was carried out of the pharmacokinetic and pharmacodynamic properties of antineoplastic agents, as well as of the results of their use in clinical practice. The search for high quality articles included primary and secondary bibliographic sources. The benefits of therapeutic monitoring were evaluated for parenteral cytotoxic drugs, oral antineoplastic drugs, monoclonal antibodies and other biological therapies used in clinical practice.
ResultsTherapeutic personalization of antineoplastic drugs based on therapeutic monitoring of plasma concentrations together with the informotion provided by pharmacokinetic-pharmacodynamic models makes it possible to reduce toxicity and increase the effectiveness of treatment. When personalized treatment is established with high-dose methotrexate in patients with osteosarcoma, target maximum concentrations are reached in 70% of the cycles (49% when fixed doses are used). When 5-fluorouracil is used in patients with colorectal cancer, the response rate is 33.7% (18.3% with fixed doses). Similar benefit rates are obtained with asparaginase, busulfan, oral antineoplastics and monoclonal antibodies.
ConclusionsDue to the narrow therapeutic range of antineoplastic drugs and the highly variable clinical response they elicit, both in terms of effectiveness and safety, the monitoring of their plasma concentrations and the application of pharmacokinetic and pharmacodynamic principles and models constitute feasible and promising tools in the personalization of oncologic treatment.
La indicación de una farmacoterapia personalizada en oncología se sustenta en la selección del tratamiento óptimo (fármacos, dosis, vías y métodos de administración y duración) y en el método de ajuste de la dosis para alcanzar la máxima eficacia antineoplásica, expresada en términos de remisión de la enfermedad o de tiempo libre de recaída, con una toxicidad aceptable para el paciente. El objetivo de este trabajo es explorar la contribución, en la personalización terapéutica en oncología clínica asistencial, de la monitorización terapéutica de las concentraciones plasmáticas y la aplicación de la información farmacocinética y farmacodinámica disponible para algunos fármacos ampliamente utilizados.
MétodoSe ha realizado una revisión bibliográfica no sistemática completa de los criterios farmacocinéticos y farmacodinámicos de los antineoplásicos, así como de los resultados derivados de su utilización en la práctica clínica asistencial. En la búsqueda de artículos de alta calidad sobre los temas planteados se han incluido fuentes bibliográficas primarias y secundarias. La utilidad de la monitorización terapéutica se ha centrado en fármacos citotóxicos parenterales, antineoplásicos orales, anticuerpos monoclonales y otras terapias biológicas utilizadas en la práctica clínica asistencial.
ResultadosLa personalización terapéutica de fármacos antineoplásicos basada en la monitorización terapéutica de las concentraciones plasmáticas, y la información que proporcionan los modelos farmaco-cinéticos-farmacodinámicos, permite reducir la toxicidad y aumentar la efectividad asociada al tratamiento. Cuando se instaura un tratamiento personalizado con metotrexato a altas dosis en pacientes con osteosarcoma se alcanza la concentración máxima objetivo en un 70% de los ciclos (49% en dosis fijas), y con 5-fluorouracilo en pacientes con cáncer colorrectal la tasa de respuesta es del 33,7% (18,3% en dosis fijas). Con asparaginasa, busulfán, antineoplásicos orales y anticuerpos monoclonales se obtienen tasas de beneficios similares.
ConclusionesDebido al bajo intervalo terapéutico de los medicamentos antineoplásicos y a su alta variabilidad en la respuesta clínica, tanto en términos de efectividad como de seguridad, la monitorización de sus concentraciones plasmáticas, y la aplicación de los principios y de los modelos farmacocinéticos y farmacodinámicos, constituyen herramientas factibles y prometedoras en la personalización de los tratamientos en oncología.
A wide range of drugs is currently available for the treatment of cancer, with dosing in most cases being calculated based on the patient's body surface area (mg/m2) or weight (mg/kg). However, this approach is associated with significant differences in terms of clinical outcomes, which is largely explained by the high inter-individual variability in the plasma (or serum) concentrations (Cp) achieved. Coefficients of variation higher than 50% in the plasma clearance of antineoplastic drugs, expressed in units of body surface area (L/h/m2) or in terms of L/h, are commonly observed, indicating that this pharmacokinetic parameter is poorly correlated with body surface area. Occasionally, differences observed in Cp may result from genetic differences or alterations in the functional status of cancer patients that affect the absorption and/or bioavailability of drugs1,2. Therefore, personalization of administration regimens of antineoplastic drugs, taking into account the patients’ characteristics, the current disease and the pharmacokinetic information provided by the drug Cp could constitute a valuable tool to reduce variability in the response observed.
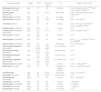
According to the International Association of Therapeutic Drug Monitoring and Clinical Toxicology (IATDMCT) therapeutic drug monitoring (TDM) is “a multidisciplinary clinical specialty aimed at improving patient care by individually adjusting the dose of drugs for which clinical experience or clinical trials have shown it improves the outcome in the general or specific populations. It can be based on a priori pharmacogenetic, demographic or clinical information and/or on the a posteriori measurement of blood concentrations of drugs and/or biomarkers”. The usefulness of this concept in the context of antineoplastic drugs is indisputable as it can be instrumental in personalizing the dosing or administration regimen and maximizing the therapeutic benefit obtained by each patient3. However, several factors have stood in the way of its implementation in the clinical setting4,5 (Table 1). Likewise, for pharmacokinetic monitoring of antineoplastic agents to be useful, the drug must meet several criteria, some of which are listed in Table 2.
Causes limiting the implementation of pharmacokinetic monitoring of antineoplastic drugs in clinical practice
| 1. Limited availability of simple, rapid and inexpensive analytical techniques for drugs and/or metabolites. |
| 2. Delays between obtaining the biological sample and quantification of the drug and/or metabolite. |
| 3. Lack of knowledge about the target values (Cp, AUC, etc.) of the drug, as a single agent and in combination chemo-immunotherapy schemes, which would allow prediction of response (effectiveness and toxicity). |
| 4. Shortage of clinical trials validating the clinical significance of introducing covariates or predictors of inter- and intra-individual pharmacokinetic variability. |
| 5. Need to obtain a large number of biological samples to accurately estimate the AUC value. |
AUC: plasma concentration-time area under the curve; Cp: drug (or metabolite) concentration in plasma or serum.
Criteria to be met by antineoplastic drugs for pharmacokinetic monitoring-based dosing individualization
| 1. High inter-individual variability of kinetic and/or dynamic processes. |
| 2. Moderate inter-occasion (or intra-individual) variability of kinetic processes. |
| 3. Narrow therapeutic window. |
| 4. Evidence that the relationship between drug exposure and therapeutic effect is superior to that between dose and response. |
| 5. Difficulty in monitoring clinical response, distinguishing between clinical response and adverse effects, or delayed clinical response over time. |
| 6. Availability of accurate analytical techniques for the determination of drug and/or metabolite levels. |
| 7. Existence of validated dosing individualization methods based on the increase of treatment effectiveness, reduction of associated morbidity and mortality and reduction of per-process costs. |
The drugs used for the treatment of cancer tend to have a narrow therapeutic range and high interindividual variability in Cp, which can lead to a suboptimal therapeutic response or increased toxicity6. These factors are magnified in cancer, who are often administered antineoplastic drugs as prodrugs or as part of combination chemo-immunotherapy schemes, which makes it difficult to establish a specific therapeutic range target for an individual drug as its achievement will depend on to the overall composition of the antineoplastic scheme. In summary, the therapeutic range of a drug may depend on whether it is administered on its own or in combination with other drugs.
The contribution that a sound understanding of pharmacokinetic and pharmacodynamic factors can make to individualized dosing in the context of oncology seems evident and unquestionably warrants the development of integrated pharmacokinetic, pharmacogenetic and pharmacodynamic models7. Such models should allow identification of specific subpopulations of patients with different clinical responses to antineoplastics resulting from their varying individual factors (genotype, renal or hepatic insufficiency, stage of disease, associated treatments, etc.), or from the presence of a resistance to the antineoplastic agent. They should also allow quantification of the influence of these covariates or predictors of the variability in the clinical response of the target population8.
Indication of personalized pharmacotherapy in oncologic patients is based on the selection of an optimal treatment (drugs, dosing, routes and methods of administration and duration) and on the dosing adjustment used to achieve maximum antineoplastic efficacy, expressed in terms of disease remission or relapse-free time, and acceptable toxicity for the patients. So far, pharmacokinetic monitoring of antineoplastic drugs has been limited if compared with other drug families. However, an increasing number of studies have demonstrated the feasibility of implementing pharmacokinetic monitoring to optimize treatment with several antineoplastics, including 5-fluorouracil, abiraterone, everolimus, imatinib, methotrexate, pazopanib, sunitinib, and tamoxifen9. Against this background, the purpose of this study was to explore the contribution of therapeutic personalization in the care of oncological patients, such personalization should be based on the therapeutic monitoring of plasma concentrations and the application of the pharmacokinetic and pharmacodynamic information available for some of the most widely used drugs.
MethodsTo explore the current situation of personalization of oncologic treatment based on therapeutic monitoring of plasma concentrations, a complete non-systematic literature review of the pharmacokinetic and pharmacodynamic characteristics of antineoplastic agents and of the evidence on their clinical use was carried out. A search for high quality articles on the topic of inquiry was carried out in PubMed without limitation of publication date and up to July 2020. The search included primary and secondary bibliographic sources (reviews) and was based on the following terms: antineoplastic agents, pharmacokinetics, pharmacodynamics, therapeutic drug monitoring as well as the different drugs and drug families.
ResultsThe following sections describe the pharmacokinetic (PK) and pharmacodynamic (PD) models supporting the development of pharmacokinetic/pharmacodynamic (PK/PD) models, as well as the current evidence of the usefulness of pharmacokinetic monitoring of antineoplastic drugs in clinical practice.
Pharmacokinetic modelsPharmacokinetic analysis of Cp-time (t) curves comprises (1) a non-compartmental analysis, in which pharmacokinetic parameters such as AUC, minimum (Cmin) or maximum (Cmax) plasma concentration and time to maximum plasma concentration (tmax) are obtained from the experimental data obtained for each individual; and (2) a compartmental analysis where the pharmacokinetic parameters that best describe the selected pharmacokinetic model (one- or bi-compartmental) are estimated from pairs of experimental Cp-t values.
Non-compartmental analysis provides a good approximation to the exposure to the drug when a large amount of data is available, but prediction of the Cp-t profiles that would be obtained using other dosing regimens is limited. In contrast, the compartmental analysis provides insight into pharmacokinetic parameters [absorption rate constant (ka), bioavailability (F), apparent volume of distribution (Vd), total clearance (Cl), etc.], whose values can be related to the pathophysiological situation of the patient and from which it is possible to predict the Cp-t curves in different dosing scenarios.
When a drug is administered intravenously (IV) the entire dose administered reaches systemic circulation and, consequently, bioavailability is rapid and complete. However, the absorption process of orally administered antineoplastic drugs is complex and is exposed to multiple factors (intestinal and/or hepatic first-pass effect, simultaneous administration with food, dosage, interactions between concomitantly administered drugs and the patient's nutritional status) that can compromise their bioavailability and may explain the significant variability in their pharmacokinetic parameters10.
Volume of distribution is the pharmacokinetic parameter that provides information on the distribution of the drug in the body. Its value depends on different factors (the patient's hydration status and plasma protein and body fat content). Circulating drug metabolites can bind to different blood components, including plasma proteins such as albumin and α-1-acid glycoprotein (AGP), and reach the different organs and tissues through various transport processes. The balance that is established between the free fraction of the drug in plasma and the fraction bound to plasma proteins is crucial for the disposition of the drug. Sometimes, differences in plasma protein levels can explain the pharmacokinetic variability observed in this parameter. For example, in a state of malnutrition and liver disorder, plasma albumin levels decrease, which leads to an increase in the free fraction of the drug. On the other hand, in acute inflammatory processes the free fraction of the drug may decrease because of increased plasma levels of AGP and other components11.
Obesity is a physiological situation that results in a significant interindividual variability in the disposition for the different antineoplastic drugs. Indeed, it is difficult to establish which weight value (actual, adjusted or ideal) should be used to calculate the body surface area and select the dose to be administered. This situation may lead to increased toxicity or a decrease in efficacy. For example, the elimination half-life of ifosfamide is prolonged in obese patients with bronchial carcinoma, which may reflect a diffusion of ifosfamide into fatty tissue12. However, it has not been demonstrated that limiting the dose of antineoplastic agents in obese patients (dosing based on ideal weight rather than actual weight) to prevent toxicity may have beneficial effects. On the contrary, it could have negative effects on the survival of this population group13.
The liver is the main organ responsible for metabolic biotransformation and, consequently, diseases affecting its metabolic and synthetic capacity may explain part of the pharmacokinetic variability observed in drug bioavailability parameters. The genetic polymorphisms of enzymes involved in phase I reactions (cytochrome P [CYP] 450), phase II reactions (glucuronosyltransferases [UGTs]) and hepatic reuptake processes (organic anion transport polyproteins [OATP]) account for a high percentage of this variability.
Excretion of antineoplastic drugs mainly occurs via the biliary and renal routes. Biliary excretion of amphiphilic and lipid-soluble antineoplastic drugs is carried out through the ABCB1 and ABCC2 transporters belonging to the ATP-binding cassette (ABC) family14, whose specific polymorphisms influence the bioavailability and anti-tumor activity of antineoplastic drugs15. Renal excretion is, together with hepatic biotransformation, the main clearance route of antineoplastic drugs. Two drugs exhibiting high pharmacokinetic variability that are cleared primarily via the kidney are carboplatin and methotrexate.
Pharmacodynamic modelsPD models are equations that establish the relationship between drug concentrations in the biophase and a (therapeutic or toxic) response. The goal is to provide the information required to explain and predict the evolution of the response to a drug after its administration (onset, intensity and duration of effect) and optimize its therapeutic benefit in an individual patient.
In oncology, the effectiveness of a treatment is evaluated based on final and intermediate clinical outcome variables. Intermediate clinical outcome variables include indicators that provide information on tumor size (RECIST criteria in solid tumors16), biomarkers, and measures that allow quantification of the clinical response over time (disease-free time, progression-free survival, overall survival, etc.). As regards the toxicity of antineoplastic drugs, the National Cancer Institute's17Common Toxicity Criteria (CTC) for the treatment of cancer are currently considered a common standard. Of all pharmacokinetic parameters, AUC is the one most frequently correlated with the efficacy and/or toxicity of antineoplastic drugs. However, most of the correlations established for pharmacokinetic parameters account for less than 70% of the evaluated response and refer mainly to toxicity.
PD models are constructed according to the mathematical characteristics of the variable used to quantify response (continuous or discrete). When the variable (effectiveness or toxicity) is continuous, the most common PD models are linear, semi-logarithmic, maximum-effect and sigmoid. The most widely used continuous response PD models include models obtained with different biomarkers, tumor size models18 and neutropenia models19. When they report a specific effect and their evolution is closely related to the final clinical outcome, biomarkers allow personalized monitoring of a disease, personalized treatment selection and/or designing the most optimal follow-up strategies for each patient20. Selection of predictive biomarkers is based on exploring biological variables that allow a priori identification of patients likely to show a good response to a given treatment and on an understanding of which of them will have a high risk of relapse. The reference biomarker for clinical outcomes in oncology is tumor size, as it forms the basis for some clinical endpoints such as disease progression, overall survival or disease-free survival, among others.
In the case of binary variables, the usual PD models are the logistic regression model, used when the time it takes for the variable to manifests itself is unimportant, and the Cox regression model, employed in the opposite case. When the variable assumes a limited number of values greater than two (CTCAE or RECIST criteria), other more complex models are used, especially when the variable is measured repeatedly over the period of time during which the patient receives treatment. If the result of two consecutive assessments can be correlated, they are studied using Markov models, which consider that the result obtained over a specific period of time are influenced by the value expressed by the variable at a previous point in time. These models are widely accepted in oncology to explain the evolution of the disease, since they can be used to model the changes observed in the patient between one stage of the disease and another, this transition being exclusively dependent on the last determination of the variable's value21–24.
Other models using clinical endpoint variables (overall survival) are based on Kaplan Meier curves and time to event models25. The latter are currently the models of choice, since they make it possible to identify an underlying risk function, obtain the risk ratio between two groups, perform simulations in different scenarios to personalize the drug administration schedule, and include covariates that may or may not change over time. Although time to event models are often referred to as survival models, other variables such as disease-free survival, progression-free survival and time to manifestation of an adverse effect can also be used in their construction.
Pharmacokinetic-pharmacodynamic (PK/PD) models can be obtained by integrating the pharmacokinetic and pharmacodynamic information obtained for the drug. Depending on the characteristics of the equilibrium established between the drug Cp (or drug concentration in another pharmacokinetic compartment) and the drug concentration in the biophase, direct effect models are obtained when the equilibrium is fast, and indirect effect models are obtained when the equilibrium takes longer to occur26.
Current evidence on the use of therapeutic monitoring of antineoplastic agents in clinical practiceMethotrexateThe paradigm for implementing pharmacokinetic monitoring of antineoplastic drugs in patients with osteosarcoma is represented by methotrexate. Given the high interocassion (intra-individual) variability in methotrexate clearance, monitoring must be performed at each administration cycle. For this drug there is an analytical technique of proven reliability as well as a PK/PD model, derived from a bicompartmental pharmacokinetic model, which allows personalized dose adjustment. The purpose of methotrexate Cp monitoring is to guarantee that the treatment is effective [by obtaining a Cmax of 1,000 µmol/L at the end of the infusion (8th hour)] and safe (by preventing the development of toxicity preventing Cp from remaining above 0.08 µmol/L for more than 96 hours)27. During pharmacokinetic monitoring it is essential to ensure proper hydration (3 L/m2), diuresis (300 mL/h) and urine alkalinization (pH ≥ 8) in order to promote adequate clearance and prevent the risk of precipitation and associated renal damage. Folinic rescue is always mandatory 12 hours after discontinuation of methotrexate and should be maintained for at least 60 hours or until Cp falls below 0.05 µmol/L. Likewise, when apparent half-life at 12 hours post-infusion is longer than 3 hours, the patient is considered to be at high risk of toxicity. To avoid this, rescue with colestipol should be initiated. Finally, the dosing regimen for the next cycle is established according to the Cp obtained during the clearance phase (24, 48 and 72 h post-infusion). Using this method means that patients with osteosarcoma treated with high-dose methotrexate reach the target Cmax in 70% of the cycles compared to 49% when fixed doses are administered28.
In the treatment of acute lymphoblastic leukemia (ALL), a correlation between methotrexate exposure and clinical effectiveness has been established. Evans et al. showed a relationship between the risk of relapse and methotrexate clearance in 108 children with ALL. Adjusting the methotrexate dose according to the patient's drug clearance profile during 24-hour infusion significantly improves clinical outcomes in this subpopulation of patients29.
However, in clinical practice, monitoring of methotrexate at high doses (> 500 mg/m2) is mainly applied in the prevention of toxicity rather than for adjusting the dose adjustment and optimizing the drug's effectiveness. Currently, delayed clearance of methotrexate is diagnosed when Cp are above 10 µmol/L at 24 hours, 1 µmol/L at 48 hours or 0.1 µmol/L at 72 hours30.
A recent study set about genotyping the organic anion polypeptide transporter 1B1 (OATP1B1) since this transporter allows uptake of methotrexate from circulating blood by hepatocytes. This transporter's genetic variants are associated with significant variability in drug clearance. The rs4149056 variant in particular is associated with decreased hepatic transport activity and has been shown to cause a moderate increase (13-26%) in the plasma clearance of the drug31,32.
5-fluorouracilHeterogeneity in the polymorphisms identified in the metabolism of 5-fluorouracil (5-FU), especially those related to dihydropyridine dehydrogenase (DPD), and their inherent intra- and inter-patient variability in patients receiving 5-FU continuous intravenous infusion, warrant pharmacokinetic monitoring of 5-FU. Nomograms, typically based on the establishment of a relationship between the Cp measured at a given time (or the AUC) and clinical response, have been used to individualize the dose of 5-FU to be administered. Thus, after determining the AUC 48 hours after the start of IV infusion, the appropriate dose for the patient is calculated to ensure the drug's effectiveness and safety as adjuvant and neoadjuvant therapy and as treatment for advanced disease in patients diagnosed with colorectal carcinoma (CRC) and squamous cell carcinoma of the head and neck (SCCHN)33. The AUC analysis has shown a good correlation with grade 3-4 toxicity, tumor response and survival, and several studies suggest better patient outcomes when a value between 20-24 mg-h/L is achieved34 (extended to 20-30 mg-h/L in continuous 46-hour infusions35). Using conventional dosing criteria for 5-FU based on body surface area, 20-30% of patients would achieve the therapeutic target for AUC and approximately 60% of patients would have lower exposure33. Pharmacokinetic monitoring of 5-FU in clinical practice has increased due to the incorporation of an automated immunoassay technique for the determination of 5-FU in plasma and has contributed to reducing variability in its exposure and toxicity rates (mainly diarrhea and hand-foot syndrome), although the results in terms of efficacy are more limited, with an acceptable increase in the response rate (33.7% vs. 18.3%)34 but poor survival improvement results in randomized clinical trials36.
The information provided by genetic analyses for the personalization of doses of fluoropyrimidines (5-FU and capecitabine) is complementary to monitoring exposure to 5-FU. Polymorphisms have been identified in the DPYD gene, which synthesizes the DPD involved in its metabolism and inactivation, resulting in a complete (0.1% of the population) or partial (3-8% of the population) deficiency of this enzyme. Different expert groups (ESMO, CPIC and DPWG)37–39 have recommended that, prior to treatment with fluoropyrimidines, the presence of four variants of the DPYD gene that have been shown to have a considerable functional and clinical impact should be analyzed: DPYD*2A and c. 1679T> G (complete deficiency), which result in complete DPD deficiency, and c.2846A> T and c.1236G> A, which result in partial deficiency. Based on the presence of these polymorphisms, recommendations are made regarding personalization of the 5-FU dose prior to initiation of treatment to reduce the potential of myelosuppression, gastrointestinal toxicity (diarrhea and/or mucositis) and neurotoxicity among other adverse events. Patients heterozygous for any of these 4 allelic variants (8% of the population) presented higher grade ≥ 3 toxicity with respect to native patients (39% vs. 23%; p = 0.0013), and DPYD genotype-guided dose personalization reduced the relative risk of developing this toxicity40. Nonetheless, it is estimated that only about 50% of cases with impaired DPD enzyme activity can be identified by these 4 variants.
The Spanish Medicines and Health Products Agency (AEMPS) has recently issued a safety note recommending genotype and/or phenotype testing for DPD deficiency in patients who are candidates for treatment with fluoropyrimidines as well as pharmacokinetic monitoring of 5-FU in patients with partial DPD deficiency. AEMPS also declared its use to be contraindicated in patients with complete DPD deficiency41.
Oral antineoplastic agentsOral antineoplastics (OAs), which are used at fixed doses in most patients, present with high inter-individual variability in their pharmacokinetic parameters, which also include release and absorption phases that are highly influenced by various pathophysiological and/or external factors. Thus, the inter-individual variability in exposure when standard doses of tyrosine kinase inhibitors are administered is between 19 and 100%. Examples of sources of pharmacokinetic variability are the first-pass effect; the presence of interactions at a metabolic level (especially via cytochrome P450) and with food; the existence of polymorphisms in transporters; renal or hepatic insufficiency; and potential problems of non-adherence to treatment, which is especially important in long-term treatments. Consequently, when standard doses are used, exposure is very likely to be below (> 30%) or above (> 15%) the therapeutic target42.
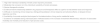
Significant exposure-response and/or exposure-toxicity relationships have been demonstrated for most OAs43. However, despite compliance with the premises required for therapeutic monitoring44, the latter's usefulness in the context of dose personalization, or in the application of alternative interventions to ensure therapeutic concentrations and increase success rates, has not been demonstrated in prospective randomized studies. Nevertheless, for some OAs pharmacokinetic monitoring is considered useful as retrospective studies have associated it with a significant clinical benefit and the maintenance of drug plasma levels within the therapeutic range, and its implementation has been shown to be feasible in clinical practice (Table 3). A prospective study is currently underway of 23 OAs in a population of more than 600 patients (with historical controls) with the aim of determining the feasibility, effectiveness (proportion of patients below the therapeutic range, objective response rate according to RECIST 1.1, progression-free survival) and safety of dose personalization based on therapeutic monitoring45. Likewise, the lack of optimal standards or circuits for implementing pharmacokinetic monitoring as part of the therapeutic personalization of OAs in clinical oncology care is evident46,47.
| Drug | Target (ng/ml) | Patients < target with standard dose (%) | Mean/median Css, min at standard dose [ng/mL] (IIV) | Exposure-response ratio (S/N) | Exposure-toxicity ratio (Y/N) | NLME model | Comments |
|---|---|---|---|---|---|---|---|
| Abiraterone | Css, min ≥ 8.448 | 35-42 | 9.3 (70%) |
| No | Yes | Ingestion with food increases exposure with no additional toxicity |
| Axitinib | AUC ≥ 30049 Css, min ≥ 550 | 38 | AUC: 367 (77%) |
| Yes (hypertension, hyperthyroidism, proteinuria, fatigue, diarrhea) | Yes | Evidence in monotherapy. Phase 2 randomized dose escalation trial with clinical benefit |
| Everolimus | Css, min 10 (11.9)-26.351 | 37 | 15.65 (IC90: 14.79-16.55) |
| Yes (pulmonary events, stomatitis) | Yes | 5 mg BID decreases Cmax and decreases the risk of toxicity with respect to 10 mg QD |
| Gefitinib | Css, min ≥ 20052 | 30 | 266 (41%) |
| Yes (dermal toxicity, diarrhea, hepatotoxicity) | No | Higher Css, min of gefitinib associated with disease control |
| Imatinib | 73 | 979 (54%) 926 (52%) |
| Yes (neutropenia, rash, diarrhea, arthralgia, edema) | Yes | Alternative to GIST Css, min ≥ 960 Evidence from randomized cohort and randomized CE studies | |
| Pazopanib | Css, min ≥ 20,50056, 57 | 16-20 | 28.100 (40%) |
| Yes (fatigue, anorexia, hypertension) | Yes | Dose of 400 mg BID and concomitant intake with food increases exposure with respect to 800 mg QD |
| Sunitinib | 49-52 | 51.6 (39%) |
| Yes (hypertension, fatigue, anorexia, myelosuppression, hand-foot syndrome, taste alteration, mucositis) | Yes | Long biological half-life of drug and metabolite: TDM in the last week of treatment prior to rest | |
| Tamoxifen |
| 20 | 9.72 (1.73-30.8) |
| No | Yes | Genotype-guided dose escalation (CYP2D6) has been shown to be safe |
| Trametinib | Css, min ≥ 10.461 | 27 | 12.1 (6-34) |
| No | Yes | Evidence in monotherapy |
AUC: plasma concentration versus time area under the curve (ng-h/ml); BID: twice daily; CCR: complete cytogenetic response; CR: complete response; Css, min: minimum concentration (pre-dose) at steady state; HR: hazard ratio; IIV: inter-individual variability; MMR: major molecular response; NDME: nonlinear mixed effect; OS: overall survival; PFS: progression-free survival; PR: partial response; PT: time to progression; QD: once daily; RR: recurrence rate; vs: versus.
Note: The Exposure-Response Ratio (Y/N) column shows the values of the indicator available under pharmacokinetic monitoring conditions and, in their absence, the available information referring to the contribution of pharmacokinetic monitoring to the referenced indicator.
Monoclonal antibodies (mAb) directed against cellular antigens have complex pharmacokinetic profiles characterized by the presence of multiple clearance pathways (proteolysis, internalization in effector cells and autoantibodies), with both dose- and time-dependent elimination half-live. Thus, clearance of the mAb may be lower at high doses than when lower doses are administered due to saturation of the antigenic receptors. On the other hand, when the antigen concentration is high, half-life decreases because the mAb binds to its epitope and is more rapidly eliminated from the body; as the antigen is depleted, clearance from plasma decreases and the plasma clearance half-life increases. Consequently, mAb clearance is a kinetic parameter that seems to play a major role in serum concentrations at the end of the dosing interval. Moreover, its high inter-individual variability (between 29 and 97%) seems to determine the risk of placing the patient outside the proposed therapeutic window62. Generally speaking, a high inter-individual variability has been observed in pharmacokinetic parameters following exposure to mAbs depending on various biometric (gender, weight or body surface area) and pathophysiological factors (glomerular filtration rate, performance status, tumor burden, histology, bone marrow infiltration, etc.). Thus, only 32% of the inter-individual variability in the rituximab clearance rate has been associated with the amount of circulating CD20 antigen, demonstrating the presence of other covariates that influence the drug's elimination63. On the other hand, the complexity is greater for cytotoxic mAb-drug conjugates or bispecific T-cell engagers (BiTEs) or multispecific mAbs. In addition to the complex pharmacokinetics of mAb, there are the characteristics of the cytotoxic agent and its release kinetics. Several studies have established significant relationships between exposure and response, which would justify the performance of prospective studies to validate the application of pharmacokinetic monitoring in clinical practice, since exposure is a predictive variable of the efficacy and/or toxicity of these targeted therapies64.
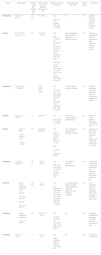
Immune checkpoint inhibitor mAbs (anti-CTLA-4, PD-1 and PD-L1) exhibit pharmacokinetic properties typical of mAbs along with a wide inter-individual variability in their kinetic parameters (30-50%) and therapeutic and toxic response65. Exposure-response relationships have been described for anti-CTL4 (ipilimumab and tremelimumab) and anti-PD-1 (nivolumab, pembrolizumab and cemiplimab) mAbs although limited data is available for anti-PD-L1 (atezolizumab, avelumab, durvalumab). For some of these mAbs, time-dependent clearance has been demonstrated (nivolumab, pembrolizumab and anti-PD-L1) and, in the case of atezolizumab, the high rate of immunogenicity observed could affect its pharmacokinetic properties. In any case, additional PK/PD studies for this group of mAbs would allow a more precise definition of the association between the concentration and/or clearance of these drugs and clinical response and would confirm the usefulness of monitoring them in clinical practice66. In addition, the correlation between weight and clearance observed in the case of ipilimumab, pembrolizumab and avelumab should be confirmed to legitimize certain claims related to the choice of a fixed dose versus a dose normalized to body weight. Variations in their nature (chimeric, humanized or human), type (IgG1-4) and even binding sites (monospecific, bispecific) and affinity may explain the differences between these mAbs’ various pharmacokinetic profiles (Table 4).
| Drug (trade name) | Ig type | Vd (L) | Clearance (mL/h) | T1/2 | Target: Cmin or AUC |
|---|---|---|---|---|---|
| Rituximab (Mabthera®, Rixathon®, Truxima®) | IgG1 | 2.7 | 25 | 22 days | Cmin: > 25 μg/mL (NHL) 67, 68 AUC: > 9,400 mg-h/L (DLBCL) 69 |
| Obinutuzumab (Gazyvaro®) | IgG1 | 3.0 | 3.3-4.6 | 26-37 days | Cmin: > 244 μg/mL when tumor > 1,750 mm270 |
| Ofatumumab (Arzerra®) | IgG1 | 5.3 | 7.5 | 21.8 days | n.a.71 |
| Bevacizumab (Avastin®) | IgG1 | 2.7-3.3 | 7.9-9.2 | 18-20 days | Cmin: > 15.5 μg/mL72 |
| Cetuximab (Erbitux) | IgG1 | 5.0 | 22 | 4 days | Cmin: > 33.8 μg/mL (SCCHN)73 Cmin: > 40 μg/mL (CCR)74 |
| Panitumumab (Vectibix®) | IgG2 | 6.54 | 14 | 7 days | n.a.75 |
| Trastuzumab (Herceptin®, Herzuma®) | IgG1 | 2.6-3.6 | 4.7-7.3 | n.a. | Cmin: > 20 μg/mL (BC)76, 77 |
| Pertuzumab (Perjeta®) | IgG1 | 2.50-3.11 | 9.8 | 18 days | n.a. 78 |
| Alemtuzumab (Campath®) | IgG1 | 10.5 | n.a. | 6 days | AUC0-12 hours: > 5 mg-h/L79 Cmin: > 13.2 mg/mL80 |
| Daratumumab (Darzalex®) | IgG1 | 4.2 | n.a. | 18-23 days | Cmin: > 274 μg/mL81 |
| Gentuzumab-ozogamicin (Mylotarg®) | IgG4 | 21.0 (mAb) | 265 (mAb) | 72 hours (mAb) | n.a. 82 |
| Brentuximab-vedotin (Adcetris®) | IgG1 | 6-10 (conj) | 73 (conj) | 4-6 days (conj) | n.a. 83 |
| Trastuzumab-emtasina (Kadcyla®) | IgG1 | 4.0 (conj) | 38 (conj) | 3-4 days (conj) | n.a. 84 |
| Inotuzumab-ozogamicin (Besponsa®) | IgG4 | 12 (conj) | 33.3 (conj) | 12.3 days (conj) | n.a. 85 |
| Blinatumomab (Blyncyto®) | n.d. | 4.5 | 122 | 2 hours | Cmin: > 1,830 pg/mL86 |
| Ipilimumab (Yervoy®) | IgG1K | 7.5 | 15 | 15 days (8-15 days for children) | Cmin: > 10 μg/mL (in vitro) 87 |
| Tremelimumab | IgG2 | 6.0 | 8-9.9 | 19-24 days | Cmin: > 30 μg/mL88 |
| Nivolumab (Opdivo®) | IgG4 | 8.0 | 7.9-9.5 | 25-26.7 days | n.a. 89 |
| Pembrolizumab (Keytruda®) | IgG4K | 7.4 | 8.3 | 27 days | Cmin: > 20 μg/mL90 |
| Cemiplimab (Libtayo®) | IgG4 | 5.2 | 8.8 | 19 days | > 60 μg/mL91 |
| Atezolizumab (Tecentriq®) | IgG1 | 6.9 | 8.3 | 27 days | > 6 μg/mL92 |
| Avelumab (Bavencio®) | IgG1A | 4.7 | 24.6 | 6.1 days | > 1 μg/mL93 |
| Durvalumab (Imfinzi®) | IgG1 | 5.6 | 8.2 | 17-18 days | n.a.94 |
BC: breast cancer; conj: conjugated mAb-cytotoxic drug; CRC: colorectal carcinoma; DLBCL: diffuse large B-cell lymphoma; IG: inmunoglobuline; n.a.: not available; NHL: non-Hodgkin's lymphoma; SCCHN: squamous cell carcinoma of the head and neck.
Asparaginase is used in chemotherapeutic regimens for the treatment of acute lymphoblastic leukemia (ALL) with increased cure rates, especially in the pediatric population. Achievement of optimal results with this therapy depends on complete and sustained depletion of serum asparagine. However, high inter-individual variability in exposure, differences in pharmacokinetic properties between different asparaginases and the formation of anti-asparaginase antibodies make it difficult to predict the degree of asparagine depletion that occurs after administration of a given dose. Under physiological conditions, the range of circulating asparagine concentrations is between 40 and 80 µM and, although there is no universal consensus, some investigators have established that asparagine deficiency is complete when plasma concentration is less than 0.1-0.2 µM. Thus, in a study in 214 children in first relapse of ALL, patients with serum asparagine levels < 1 µM on day 14 were more likely to achieve a second remission compared to patients with higher levels95. However, due to the rapid ex vivo metabolism of asparagine in the presence of asparaginase, and the complexity of the analysis, direct determination of asparagine concentration in vivo is challenging. The ALL therapeutic monitoring program should also include determination of asparaginase activity (≥ 100 IU/L; between 100-250 IU/L), and of anti-asparaginase antibodies, thus identifying situations of subclinical hypersensitivity and suboptimal enzyme activity (silent inactivation), personalizing current treatment, or evaluating the benefit of a change of formulation96. This would allow identification of situations where patients develop allergic-type reactions, but no enzymatic inactivation, and therefore do not require a change of formulation to ensure adequate treatment.
Busulfan represents the cornerstone of many myeloablative regimens. It is frequently administered in a two-hour infusion every 6 hours for 4 days. Monitoring of the therapy is recommended during the first dose to individualize subsequent doses by calculating the AUC from three plasma samples (end of infusion, 4 and 6 hours post-infusion). Currently, the therapeutic target is an AUC between 900-1,350 µM-min in pediatric patients and 900-1,500 µM-min in adults (four times higher for daily dosing schedules). AUC can be estimated by non-compartmental analysis, population pharmacokinetic models, or pooled sampling methods with a small number of samples97,98. Monitoring minimizes the incidence of hepatic veno-occlusive disease and neurologic toxicity, as well as graft failure and disease recurrence. Pediatric patients present with greater pharmacokinetic variability than adult patients. The variability is highest among newborns and infants < 9 kg, 40% of whom reach off-target AUC values, which makes monitoring particularly necessary in this subpopulation of patients99.
Carboplatin dosing is based on patients’ renal function (the main source of pharmacokinetic variability) and exposure to this drug (AUC) has been shown to correlate well with therapeutic response and toxicity in both pediatric and adult patients. Carboplatin monitoring is recommended mainly in patient subpopulations where exposure is more unpredictable, a positive impact of the treatment having been demonstrated for example in children with cancer on intensification regimes based on high carboplatin doses. In such cases, there is a higher risk of severe toxicity, and the degree of bioavailability may be more variable than in adult patients100. Likewise, monitoring can have a significant impact on anuric patients and those with renal failure, where non-renal clearance predominates. In obese patients, dosing based on total body weight (TBW) overestimates the renal clearance of carboplatin by more than 20%; conversely, ideal body weight (IBW) may underestimate clearance. The best weight value for carboplatin dosing in obese patients is the intermediate value between ideal and total weight (IBW*0.512x[TBW-IBW])101. Regarding myelotoxicity, population PK/PD models have described the impact of exposure to carboplatin on thrombocytopenia to be 1.45 times higher when administered in schedules with etoposide; 2.33-times higher with gemcitabine; and 0.764 times higher (protective effect) with paclitaxel102.
Several PK/PD studies have analyzed exposure-effectiveness relationships or exposure-toxicity relationships for taxanes such as paclitaxel and docetaxel. The usefulness of paclitaxel monitoring using Bayesian methods in reducing inter-individual variability has been demonstrated. However, although the time during which paclitaxel concentration exceeds 0.05 µM (42.7 µg/mL) may be considered a predictor of hematologic toxicity, neuropathy, and therapeutic response, further studies are required to confirm its clinical benefit99. In a prospective randomized controlled trial conducted to evaluate the feasibility and performance of docetaxel dosing based on AUC as a predictor of myelotoxicity and febrile neutropenia, inter-individual variability in the individualized treatment group was over 50% lower than in the body surface area-based dosing group103.
Irinotecan is another antineoplastic that is a good candidate to monitoring due to the high inter-individual variability in the metabolism of its active metabolite SN-38 mediated by UDP glucuronosyltransferase 1A1 (UGT1A1). In this case, a genetic approach is the most appropriate way of reducing the risk of toxicity (neutropenia and digestive toxicity). Several functional polymorphisms have been identified in the UGT1A1 gene (UGT1A1*28 in European, African and Latin populations and UGT1A1*6 in Asian populations mainly; UGT1A1*36 and UGT1A1*37 almost exclusively in African populations), leading to low enzyme expression and decreased glucuronidation activity, which have a significant impact on the incidence of toxicity. As a result, determination of these polymorphisms should be routinely carried out to identify patients at risk of severe toxicity where lower doses should be administered at initiation of treatment104,105. This strategy is especially useful in dose-intensive irinotecan regimens that have only been shown to be safe in patients homozygous for the UGT1A1*1 variant. The Royal Dutch Pharmacists Association - Pharmacogenetics Working Group has recommended an initial dose reduction of 30% for individuals homozygous for the UGT1A1*28 variant, or poor metabolizers, and a subsequent increase based on neutrophil count106. On the other hand, the Group of Clinical Onco-pharmacology (GPCO-Unicancer) and the National Pharmacogenetics Network (RNPGx) have recommended an initial dose reduction of 30% in UGT1A1*28 homozygous individuals for dosing schedules between 180 and 230 mg/m2 (if dose is lower than 180 mg/m2 no dose adjustment is proposed). In contrast, administration of the full dose in dosing schedules ≥ 240 mg/m2 is only recommended in patients homozygous for the UGT1A1*1 variant and in UGT1A1*1/*28 heterozygous patients in the absence of risk factors and under strict surveillance107.
Final considerations and conclusionsHistorically, therapeutic drug monitoring or TDM has focused primarily on measuring drug exposure and analyzing pharmacokinetics in an individual patient. The examples given above are a representation of the application of PK/PD criteria in TDM, increasingly established in the management of oncologic drugs. However, application of pharmacokinetic monitoring in clinical practice is still infrequent, perhaps because there is still much to be learned about the clinical benefits, in terms of the toxicity and especially the effectiveness of antineoplastic treatments, provided by personalizing therapy on the basis on the pharmacokinetic information provided by the PC determination.
In this sense, interpretation of Cp is a key aspect as it is serves as a basis for personalized dose adjustments. It is therefore necessary to know which pharmacokinetic exposure parameter (Cmin, Cmax, AUC, etc.) is best correlated with the response to each antineoplastic drug. Considering the principles behind PD models, the PK parameter of choice should be AUC, but the pharmacokinetic analyses performed in various clinical trials have identified Cmin as a surrogate measure of the exposure to a given drug. This measure is particularly well suited to dose adjustment in the case of drugs with a prolonged terminal half-life. However, for drugs with nonlinear (concentration-dependent or time-dependent) pharmacokinetic profiles including nivolumab, whose clearance varies over time and is related to treatment efficacy, or asparaginase, whose pharmacokinetics is related to the formulation used, or several mAbs, personalized dose based on Cp monitoring is more complex.
Currently, PK parameters are obtained from the available databases, using population pharmacokinetic (or pharmacometric) resources, where the models obtained characterize drugs’ pharmacokinetic profiles for the typical individual and quantify the effect of the covariates that explain part of the inter-individual pharmacokinetic variability. In the context of therapeutic personalization, the benefits of pharmacokinetic monitoring are indisputable, not only because it increases the probability of achieving therapeutic benefits but also because PK, PD and/or PK/PD models make it possible to predict, through simulation exercises, the drug exposure achieved by patients on other dosing regimens and select the optimal scenario, after comparing the results obtained in different situations. However, these benefits can only be achieved when the models have been obtained from a minimum number of Cp. Only then will it be possible to overcome the inaccuracies inherent in the models and take advantage of the capacity and potential of current computing tools to characterize the PK parameters and their sources of variability with a view to personalizing oncological treatments so that the majority of treated patients achieve the maximum therapeutic benefit.
The present review of studies on the personalization of antineoplastic drugs based on pharmacokinetic-pharmacodynamic model-based therapeutic drug monitoring indicates that such individualization of treatment allows a reduction in the toxicity and an increase in the effectiveness associated with the treatment. Specifically, when personalized treatment with high-dose methotrexate is administered to patients with osteosarcoma, the target Cmax is reached in 70% of cycles (49% in fixed doses) and when personalized treatment with 5-fluorouracil is administered to patients with colorectal cancer the response rate is 33.7% (18.3% in fixed doses). Similar benefit rates are obtained with asparaginase, busulfan, oral antineoplastics and monoclonal antibodies. Therefore, due to the narrow therapeutic window of antineoplastic drugs and the high variable clinical response they elicit, both in terms of effectiveness and safety, monitoring their plasma concentrations, and applying pharmacokinetic and pharmacodynamic principles and models, constitute feasible and promising tools in the personalization of treatments in oncologic patients.
FundingNo funding.
Conflict of interestsNo conflict of interests.


Farmacia Hospitalaria sigue las recomendaciones para la preparación, presentación y publicación de trabajos académicos en revistas biomédicas
- Inicio
- Todos los contenidos
- Publique su artículo
- Acerca de la revista
- Métricas