


Evidence on the usefulness of proactive monitoring of vedolizumab serum concentrations during the induction phase of treatment is limited. The objective of our study was to evaluate the effectiveness of measuring such concentrations during this phase in predicting response to treatment in patients with ulcerative colitis with a view to determining whether patients would benefit from early monitoring of vedolizumab serum concentrations.
MethodThis was a prospective descriptive study carried out at three public general hospitals. It included adult patients with ulcerative colitis who were initiated on vedolizumab at the participating hospitals from June 2019 to June 2020. Vedolizumab serum concentrations were determined at weeks 6 and 14. Response to treatment was biologically, clinically, and endoscopically evaluated at weeks 6, 14, and 52. An analysis was made of the relationship between vedolizumab serum concentrations at week 6 and early response to treatment, and of the relationship between the vedolizumab serum concentrations at weeks 6 and 14 and persistent response at one year.
ResultsA total of 45 patients were included of whom 22 (49%) were considered non-responsive after one year and required intensification of treatment. The median (interquartile range) vedolizumab serum concentrations obtained at 6 weeks was higher in patients who obtained an early response and in those who maintained the response at one year than in those who did not respond to vedolizumab [27.4 (19.0-40.8) µg/mL vs 15.6 (13.4-28.5) µg/mL; p = 0.018] and [29.9 (19.2-43.2) µg/mL vs 18.2 (15.4-26.9) µg/mL; p = 0.022] respectively. Vedolizumab serum concentrations ≥ 17.3 µg/mL at week 6 were predictive of a good early response, and vedolizumab serum concentrations ≥ 26.1 µg/mL at week 6 predicted a sustained response at one year. No relationship was found between vedolizumab serum concentrations at week 14 and a sustained response.
ConclusionsWe observed a relationship between vedolizumab serum concentrations determined at week 6, and early and maintained response to vedolizumab therapy in patients with ulcerative colitis, which supports early drug monitoring during the induction phase to individualize treatment and increase effectiveness.
La evidencia sobre la utilidad de la monitorizadón proactiva de las concentraciones séricas de vedolizumab en la fase de inducción del tratamiento es limitada. El objetivo del estudio ha sido evaluar la capacidad de las concentraciones séricas de vedolizumab determinadas en esta fase para predecir la respuesta al tratamiento en pacientes con colitis ulcerosa, con el fin de establecer si los pacientes se beneficiarían clínicamente de una monitorización precoz.
MétodoEstudio descriptivo, prospectivo, realizado en tres hospitales generales públicos. Incluyó a los pacientes adultos con colitis ulcerosa, que iniciaron tratamiento con vedolizumab en los centros participantes desde junio de 2019 a junio de 2020. Se determinaron las concentraciones séricas de vedolizumab en las semanas 6 y 14 de tratamiento. La respuesta bioquímica, clínica y endoscópica se evaluó en las semanas 6, 14 y 52. Se estudió la relación de las concentraciones séricas de vedolizumab determinadas en la semana 6 con la respuesta temprana al tratamiento, así como la relación de las concentraciones séricas de vedolizumab en las semanas 6 y 14 con la persistencia de respuesta al año de tratamiento.
ResultadosSe incluyeron 45 pacientes, de los que 22 (49%) se consideraron no respondedores al cabo de un año y necesitaron intensificar el tratamiento. Las medianas (rango intercuartílico) de las concentraciones séricas de vedolizumab en la semana 6 fueron superiores, tanto en los pacientes que presentaron respuesta temprana como en los que mantuvieron respuesta al cabo de un año, comparadas con las de los pacientes que no respondieron a vedolizumab [27,4 (19,0-40,8) µg/ml vs 15,6 (13,4-28,5) µg/ml; p = 0,018] y [29,9 (19,2-43,2) µg/ml vs 18,2 (15,4-26,9) µg/ml; p = 0,022], respectivamente. Las concentraciones séricas de vedolizumab > 17,3 µg/ml en la semana 6 predijeron una buena respuesta temprana, y concentraciones séricas de vedolizumab > 26,1 µg/ml en la semana 6 predijeron una respuesta mantenida al cabo de un año. No se encontró relación entre las concentraciones séricas de vedolizumab en la semana 14 y la respuesta mantenida.
ConclusionesSe ha observado una relación entre las concentraciones séricas de vedolizumab determinadas en la semana 6 y la respuesta temprana y mantenida a la terapia en pacientes con colitis ulcerosa, lo que avala la monitorización precoz durante la fase de inducción, para individualizar el tratamiento y aumentar su eficacia.
The development of biologic drugs has led to significant progress in the treatment of inflammatory bowel disease. Their use has been associated with a lower incidence of flare ups, fewer hospital admissions, a reduction in surgical procedures, and an increase in patient quality of life1.
Vedolizumab is a humanized monoclonal antibody acting predominantly at the intestinal level. It is typically indicated as a second-line treatment in patients who did not respond to or were unable to tolerate previous pharmacological therapy, including tumor necrosis factor alpha inhibitors (anti-TNFs)2. The fact that vedolizumab acts specifically at the intestinal level provides a favorable safety profile and makes it the only valid pharmacological alternative to surgery for a considerable number of patients, especially those with ulcerative colitis (UC) in which cases its effectiveness has been shown to be similar to that of anti-TNFs3,4. For that reason, the use of vedolizumab in these patients should be optimized in order to improve clinical outcomes and maximize the time patients receive the treatment.
Several studies have demonstrated a highly inter- and intraindividual variability in response to vedolizumab, which appears to be associated, at least partially, with the high variability that characterizes exposure to the drug5. In fact, it has been shown that serum concentrations of vedolizumab are related to patient response to treatment6–13. Serum concentration variability has been attributed to the development of anti-vedolizumab antibodies (AVAs) capable of creating immune complexes that are eliminated quickly, which results in increased plasma clearance and a reduction in therapeutic effect14. Other factors have also been shown to influence vedolizumab serum concentration (VSC) variability, including albumin concentrations, body weight and C-reactive protein (CRP) levels12.15.
Therapeutic VSC monitoring has been proposed as a useful tool for dose individualization and optimization of patient response to treatment14–18. However, the evidence available at the present time is scarce and some aspects still need to be determined regarding the most effective way to implement this tool in clinical practice, particularly the optimum moment to measure VSC and make appropriate dosing adjustments during the course of treatment. It is generally agreed that VSC monitoring should be used during the maintenance stage when patients do not exhibit a favorable response to treatment in order to differentiate between patients with low serum concentrations who could benefit from a dosing adjustment and those who fail to respond despite adequate exposure. This is what is known as reactive monitoring19. Proactive monitoring, for its part, has been the subject of greater debate. Although some studies support its application8–11, there is no consensus on the advisability of using it in all patients, not even early on during the treatment induction phase so that optimal concentrations of the drug can be achieved from the outset.
The objective of our study was to evaluate the capacity of VSCs measured during the induction phase to predict treatment response to this medication in patients with UC, and to determine whether patients would benefit from early proactive monitoring of their VSCs.
MethodsThis was a low-intervention descriptive multicenter prospective study carried out in three public general hospitals of over 500 beds each. The study was approved by the Drug Research Ethics Committee at the reference hospital (PI 2019/06/327), and also obtained the approval of the two other hospitals involved. All patients who agreed to participate in the study signed the relevant informed consent forms.
The study included adult patients diagnosed with moderate to severe UC, i.e., with a partial Mayo index (pMI) > 420, who were started on treatment with vedolizumab at the participating hospitals between June 2019 and June 2020 due to a loss of response, intolerance or contraindication to treatment with anti-TNFs. Patients who discontinued their treatment within the first 10 weeks because of a loss of response and those who were transferred to other hospitals were excluded from the study.
The following information was obtained before patients were included in the study: age, sex, height, total body weight, body mass index, extent of the disease, age at diagnosis, previous anti-TNF treatment, and presence of anti-TNF antibodies. The extent of UC was determined following the Montreal classification21.
The initial dose of vedolizumab was established in accordance with the dosing guidelines provided in the drug's SmPC. Later on, the prescribing physician modified the dosing regimen as a function of patients’ responses to treatment and/or the evolution of VSC.
VSCs was measured at weeks 6 and 14 just before the next dose was to be administered. Samples were centrifuged at 2,000 g for 10 minutes, and the serum obtained was divided into two aliquots which were stored in a freezer at a temperature ranging from –80 °C to –20 °C awaiting further analysis. The samples were evaluated using a RIDASCREEN® anti-idiotype ELISA assay developed by R-Biopharm® and distributed in Spain by Menarini Diagnósticos. The lower quantification limit for this assay is 0.15 µg/mL. The disadvantage of this technique is that it is drug-sensitive, which prevents reliable detection of AVAs when VSC are above 0.15 µg/mL. Given that the technique is prone to a high rate of antibody false negatives, AVA levels were not determined.
Response to treatment was evaluated at weeks 6, 14 and 52 after the start of treatment, as well as whenever a loss of response was detected during the first year. For this purpose, a series of biochemical, clinical and endoscopic variables were recorded. Biochemical variables were serum albumin, fecal calprotectin (FC) and CRP levels, and the clinical and endoscopic variables were pMI and the Mayo endoscopic index (MEI), respectively. Patients were monitored during the first year of treatment or, in cases of inadequate response, until treatment discontinuation.
At week 6, we measured patients’ VSCs and compared these with their early responses to treatment. We also analyzed the relationship of the concentrations measured at weeks 6 and 14 with the persistence of response at one year of treatment. The main variable was persistence of response at one year of treatment. The need to administer an additional dose of the drug at week 10 into the induction phase was considered to be indicative of a lack of early response when a lack of clinical response had been observed at week 6, with a pMI > 2 points, FC > 200 mg/kg and no normalization of CRP with respect to the baseline value. In addition, the need to intensify treatment because of a worsening of symptoms (pMI > 2, FC > 100 mg/kg or CRP increase with respect to baseline), or detection of endoscopic or radiographic findings indicative of active disease (MEI > 1 or at endoscopist's discretion) was considered suggestive of a loss of response within the first year.
Statistical analysisContinuous variables were described as medians and interquartile ranges (IQRs), or as mean and standard deviation (SD), and categorical variables were described as frequencies and percentages. Continuous variables were compared by means of Student's t test or Wilcoxon's signed rank test and categorical variables were compared using the chi-squared test or Fisher's Exact Test, as appropriate.
The mean and median VSCs of patients exhibiting an early response and of patients in whom response persisted at one year were compared with those of patients who did not exhibit an early response or a persistence thereof. Moreover, a quartile analysis was made of VSCs and their relationship with response to treatment. The VSC cut off point predicting therapeutic outcomes was established by means of an analysis of receiver operating characteristic (ROC) curves.
Lastly a sensitivity analysis was conducted to determine whether there could be variables other than VSC that could influence the patients’ early and/or sustained response to treatment. To this end, a univariate binary logistic regression analysis was carried out. When the result of the analysis for any of the variables was a p value < 0.01, a multivariate binary logistic regression analysis was performed.
All p values were based on a bilateral hypothesis, with values < 0.05 being considered statistically significant. The statistical analyses were conducted using the R 4.1 software environment and language (Comprehensive R Network, http://cran.r-project.org).
ResultsThe study included a total of 47 patients who were initiated on treatment with vedolizumab. Two patients had to be excluded from the analysis as their treatment was withdrawn within the first 10 weeks due to the appearance of severe flare-ups caused by a lack of response to the medication. A total of 45 patients completed the one-year follow-up, of whom 22 (49%) were considered non-responsive as they presented a loss or a lack of response within the first year and required intensification of treatment. In fifteen (33%) of these patients an additional dose of vedolizumab was necessary at week 10 due to the absence of an early response. During follow-up, treatment had to be discontinued in 11 patients (24%) who presented a loss of response despite treatment intensification.
Table 1 shows the main demographic and clinical characteristics of patients with a loss or lack of response within the first year of treatment. Prior to initiation of treatment, non-responding patients presented with higher baseline CRP and FC values than responding ones [median IQR: 0.39 (0.26-2.56) mg/dL vs 0.18 (0.06-1.39) mg/dL; p = 0.181, and 390 (220-1,270) mg/kg vs 302 (42-737) mg/kg; p = 0.123, respectively], although no statistically significant differences were found. The percentage of patients who had received previous treatment with anti-TNFs was higher in the non-responsive group (55% vs 35%), although this difference was not statistically significant either (p = 0.301).
Main demographic and clinical characteristics at the time of inclusion into the study of responders and non-responders to treatment with vedolizumab during the first year of treatment
| Total (n = 45) | Responders (n = 23) | Non-responders (n = 22) | P value | |
|---|---|---|---|---|
| Females [n (%)] | 20 (44) | 11 (48) | 9 (41) | 0.75 |
| Age at initiation of vedolizumab, years [median (IQR)] | 62 (48-72) | 66 (48-73) | 57 (42-71) | 0.18 |
| Age at diagnosis, years [median (IQR)] | 50 (33-66) | 55 (41-66) | 48 (29-66) | 0.51 |
| Body weight, kg [mean (SD)] | 72.93 (15.44) | 73.02 (11.60) | 72.71 (18.84) | 0.94 |
| Height, cm [mean (SD)] | 168 (9) | 167 (9) | 168 (9) | 0.70 |
| Body mass index, kg/m2 [mean (SD)] | 25.91 (5.43) | 26.08 (3.20) | 25.83 (7.07) | 0.88 |
| C-reactive protein levels at the beginning of treatment, mg/dL [median (IQR)] | 0.36 (0.12-1.45) | 0.18 (0.06-1.39) | 0.39 (0.26-2.56) | 0.18 |
| Fecal calprotectin at the beginning of treatment, mg/kg [median (IQR)] | 322 (157-812) | 302 (42-737) | 390 (220-1,270) | 0.12 |
| Proctitis [n (%)] | 5 (12) | 4 (17) | 1 (5) | |
| UC extension Left-sided colitis [n (%)] | 20 (44) | 10 (43) | 10 (45) | 0.37 |
| Extensive colitis [n (%)] | 20 (44) | 9 (40) | 11 (50) | |
| Previous treatment with anti-TNFs [n (%)] | 20 (44) | 8 (35) | 12 (55) | 0.30 |
| Positive anti-TNF antibodies [n (%)] | 3 (7) | 1 (4) | 2 (9) | 0.97 |
Anti-TNF: tumor necrosis factor inhibitor; IQR: inter-quartile range; SD: standard deviation; UC: ulcerative colitis.
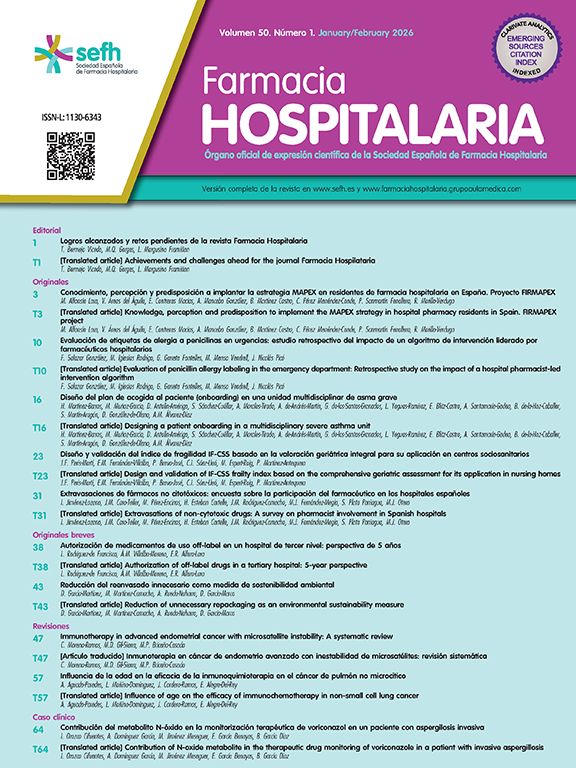
Figure 1 presents an analysis of the relationship between VSC at week 6 and early response to treatment. Figure 1A is a boxplot displaying the distribution of week 6 VSCs of responsive patients and of those who did not respond early to treatment. Mean (IQR) week 6 VSCs of responsive patients were higher than those of non-responders [27.4 (19.0-40.8) µg/mL vs 15.6 (13.4-28.5) µg/mL, respectively; p = 0.018]. On the other hand, a distribution of VSCs into quartiles (Figure 1B) showed that the percentage of patients with early responses was lower in the first quartile (18%), while it was similar for the other quartiles (91%, 82% and 73%, respectively).

Analysis of the relationship between vedolizumab serum concentration (VSC) at week 6 and early response to treatment.A.Boxpiot displaying the distribution of the VSC measured at week 6.B.Percentage of patients showing an early response to treatment with vedolizumab in each quartile at week 6.C.ROC curve of the VSC at week 6 and early response to treatment with the drug.
A ROC curve analysis of week 6 VSCs, performed to predict which patients would display an early response to treatment, obtained a cutoff point of 17.3 µg/mL, with an area under the curve (AUC) of 0.726 (95%: 0.551-0.901; p = 0.023) (Figure 1C), which corresponds to a sensitivity of 60% and a specificity of 92%. This would appear to indicate that VSC > 17.3 µg/mL at week 6 indicates achievement of response during the induction phase.
The sensitivity analysis (Table 2) showed that, in addition to the VSC < 17.3 µg/mL measured at week 6 (OR: 164.0; 95% CI: 11.0-12,088.4; p = 0.002), the presence of high FC values at initiation of treatment was associated with a greater incidence of patients lacking early response, although this did not reach clinical significance (OR: 1.0; 95% CI: 1.0-1.0; p = 0.043).
Variables associated with need for early intensification at week 10 of vedolizumab treatment
| Prognostic factor | Univariate analysis | Polivariate analysis | ||||
|---|---|---|---|---|---|---|
| P value | OR | CI 95% | P value | OR | CI 95% | |
| Sex (ref. female) | 0.671 | − | − | − | − | − |
| Age at initiation of vedolizumab | 0.359 | − | − | − | − | − |
| Age at diagnosis | 0.728 | − | − | − | − | − |
| Body weight | 0.247 | − | − | − | − | − |
| Body mass index | 0.293 | − | − | − | − | − |
| C-reactive protein levels at the beginning of treatment | 0.353 | − | − | − | − | − |
| Fecal calprotectin at the beginning of treatment | 0.086 | 1.0 | 1.0-1.0 | 0.043 | 1.0 | 1.0-1.0 |
| UC extension (ref. proctitis) | 0.827 | − | − | − | − | − |
| Previous treatment with anti-TNFs | 0.832 | − | − | − | − | − |
| Positive anti-TNF antibodies | 0.239 | − | − | − | − | − |
| Vedolizumab concentration at week 6 < 17.3 μg/mL | 0.001 | 18.0 | 3.6-141.2 | 0.002 | 164.0 | 11.0-12,088.4 |
Anti-TNF: tumor necrosis factor inhibitor; CI 95%: 95% confidence interval; OR: odds ratio; UC: ulcerative colitis.
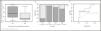
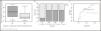
Table 3 shows VSC at weeks 6 and 14 in patients who responded to treatment within one year of initiation of treatment and in those who did not. Statistically significant differences were observed in week 6 mean concentrations (SD) between responsive patients and those where response was lost within the first year [30.0 (11.5) vs 22.2 (10.8); p = 0.030]. Figure 2A is a boxplot displaying the distribution of week 6 VSC in the two groups, and figure 2B shows the distribution of VSC into quartiles, together with the likelihood of obtaining a favorable response during the first year of treatment. The rate of favorable responses was lower in the first quartile (19%) but similar in the other quartiles (62%). The ROC curve analysis (Figure 2C) yielded a cut-off point of 26.1 µg/mL with an AUC of 0.711 (95% CI: 0.549-0.872; p = 0.002), which corresponded to a sensitivity of 65% and a specificity of 71%.
Vedolizumab serum concentrations in responders and non-responders at one year of treatment
| Total (n = 45) | Responders (n = 23) | Non-responders (n = 22) | P value | |
|---|---|---|---|---|
| Vedolizumab concentrations at week 6, μg/mL | ||||
| Median (IQR) | 24.8 (16.8-33.8) | 29.9 (19.2-43.2) | 18.2 (15.4-26.9) | 0.02 |
| Mean (SD) | 26.0 (11.7) | 30.0 (11.5) | 22.2 (10.8) | 0.03 |
| Vedolizumab concentrations at week 14, μg/mL | ||||
| Median (IQR) | 14.6 (10.6-19.3) | 13.5 (9.9-18.0) | 18.2 (13.1-20.8) | 0.12 |
| Mean (SD) | 16.4 (7.1) | 14.6 (7.0) | 18.1 (7.0) | 0.14 |
QR: inter-quartile range; SD: standard deviation.

Analysis of the relationship between vedolizumab serum concentration (VSC) at week 6 and response to treatment during the first year.A.Boxplot displaying the distribution of the VSC measured at week 6.B.Percentage of patients showing a favorable response to treatment with vedolizumab during the first year in each concentration quartile at week 6.C.ROC curve of the VSC at week 6 and favorable response to treatment with the drug during the first year.
No statistically significant differences were found in VSCs measured at week 14 in patients who exhibited a favorable response to treatment during the first year as compared with those who presented with a loss of response and who had their treatment intensified [14.6 (7.0) vs 18.1 (7.0); p = 0.138] (Table 3). Nor were there any statistically significant differences observed between both groups if patients receiving additional doses at week 10 of the induction phase were excluded [14.4 (5.8) vs 17.7 (6.3); p = 0.292].
The sensitivity analysis (Table 4) did not identify any additional variable contributing to the achievement of a sustained response within the first year of treatment.
Variables associated with loss of response and need for treatment intensification with vedolizumab during the first year of treatment
| Prognostic factor | Univariate analysis | ||
|---|---|---|---|
| P value | OR | CI 95% | |
| Sex (ref. female) | 0.641 | − | − |
| Age at initiation of vedolizumab | 0.183 | − | − |
| Age at diagnosis | 0.504 | − | − |
| Body weight | 0.936 | − | − |
| Body mass index | 0.871 | − | − |
| C-reactive protein levels at the beginning of treatment | 0.213 | − | − |
| Fecal calprotectin at the beginning of treatment | 0.268 | − | − |
| UC extension (ref. proctitis) | 0.239 | − | − |
| Previous treatment with anti-TNFs | 0.185 | − | − |
| Positive anti-TNF antibodies | 0.532 | − | − |
| Vedolizumab concentration at week 6 < 26,1 μg/mL | 0.010 | 5.9 | 1.6-24.5 |
| Vedolizumab concentration at week 14 < 14,6 μg/mL | 0.143 | − | − |
Anti-TNF: tumor necrosis factor inhibitor; CI 95%: 95% confidence interval; OR: odds ratio; UC: ulcerative colitis.
The evidence available on the usefulness of therapeutic drug monitoring of VSCs is limited. Before we can recommend implementation of this strategy in clinical practice, we need prospective studies providing information on the various practical aspects of VSC monitoring. One of the key points that remains to be determined is the moment at which VSC should be measured with a view to adjusting the dose administered. Experts have traditionally recommended reactively monitoring concentrations of biologic drugs in patients with inflammatory bowel disease and inadequate response to treatment16. However, doubts exist regarding the potential usefulness of proactive monitoring, which consists of periodically measuring VSC during quiescent periods as a condition to ensure optimal dosing and permanence of concentrations within the therapeutic range, thus preventing potential flare-ups and averting treatment failure. In this respect, some authors8–11 have argued the need for early monitoring of VSCs. The present study was designed to evaluate the usefulness of measuring VSC during the induction phase of treatment with a view to predicting initial response and long-term maintenance.
A cohort of patients with UC was selected for this study, since it appears that the efficacy of vedolizumab is similar to that of anti-TNF agents. Moreover, some authors have demonstrated a closer correlation between VSC and response to treatment in patients with UC as compared with those affected with Crohn's disease5,22. The cohort was subjected to a prospective one-year follow-up. The first measurements, made at week 6 found a relationship between the concentrations determined at that time and early response to treatment. In fact, a cut-off point of 17.3 mg/mL was established for early response, defined as no need to administer an extra dose of the drug at week 10 due to a lack of response. Up to that point, no analysis had been made of the relationship between the VSC measured at week 6 and early response. However, according to a French multicenter study8, VSC <18.5 mg/mL at week 6 was correlated with the need to shorten the dosing interval to 4 weeks during the first six months of treatment.
On the other hand, our study proposal of a higher cut-off point, 26.1 mg/mL for long-term sustained response to treatment, defined as the need of treatment intensification during the first year due to a loss of response. Nevertheless, it was not possible to establish a relationship between the concentration values obtained at the second measurement, carried out at week 14, and sustained effectiveness. This was probably due to the fact that a high number of patients had received an extra dose of the drug at week 10. The cut-off point established in this study for long-term response to treatment is higher than that proposed by other authors. In a prospective study of 110 patients with inflammatory bowel disease, Guidi et al.10 measured vedolizumab concentrations at weeks 6 and 14 and established a cut-off point at week 14 of 16.6 mg/mL, above which there was a higher chance of maintaining both clinical remission and mucosal healing within the first year. However, the authors did not obtain conclusive results for week 6. Yacoub et al.9, in a study of 44 patients with inflammatory bowel disease, established a cut-off point at week 6 of 18.0 mg/mL for mucosal healing during the first year.
Although the cut-off point proposed in our study (26.1 µg/mL) to predict a long-lasting response is higher than that suggested by other authors and could therefore raise doubts related to safety, previous studies have shown that patients reaching high minimum concentrations are not exposed to a higher risk of side effects23. In fact, other authors have proposed even higher cut-off values than ours. Liefferinckx et al.11, in a study of 103 patients with inflammatory bowel disease with a mean follow-up of 11 (3-27) months, showed that VSC > 28 mg/mL at week 6 were predictive of a sustained response.
The limitations of the present study include its small sample size as only patients with UC were selected. Moreover, the titer of AVAs was not quantified in patients with low vedolizumab concentrations, which might have prevented them from being switched to other lines of treatment. Also, no genetic study was performed of polymorphisms related to vedolizumab that could be included in the covariant analysis. Despite all these limitations, the prospective nature of the study is an indisputable virtue. In addition, given that drug therapeutic ranges may vary as a function of specific conditions, selection of a very specific population of patients with inflammatory bowel disease (patients with UC but not with Crohn's disease) is another strength of the study. Further randomized clinical trials should be conducted with larger cohorts to confirm the clinical usefulness of reactive monitoring as compared with the absence of monitoring in the context of different inflammatory diseases.
In conclusion, the present study found a relationship between VSC measured at week 6 and early and sustained response to treatment in patients with UC. This confirms the usefulness of early monitoring during the induction phase in order to individualize drug dosing and increase the effectiveness of therapy.
FundingThis study has been undertaken with the help of the Spanish Foundation for Hospital Pharmacy (FEFH) and the Spanish Society of Hospital Pharmacy (SEFH) through grants for research and innovation in the field of hospital pharmacy, call 2018 -2019.
AcknowledgmentsOur thanks to:
R. Fernández Caballero, A. Fernández Pordomingo, M. García Alvarado, M. C. Piñero Pérez and V. Prieto Vicente (Hospital Universitario de Salamanca).
N. Borruel Sainz, F. Casellas Jordá and M. Q. Gorgas Torner (Hospital Universitario Vall d'Hebron de Barcelona).
J. Guardiola Capón (Hospital Universitario de Bellvitge de Barcelona).
J. S. Pérez Blanco (Facultad de Farmacia de la Universidad de Salamanca).
Conflict of interestsFernando Muñoz has been a consultant to Takeda and has served at the speakers’ bureau.
Contribution to the scientific literature
Information on the usefulness of monitoring vedolizumab serum concentrations – particularly at the onset of treatment, is still limited.
The present study demonstrates that measuring vedolizumab serum concentrations at week 6 helps optimize treatment in patients with concentrations < 17.3 µg/mL and that vedolizumab levels ≥ 26.1 µg/mL predict a sustained response at one year from the start of treatment.

