
The objective of the study was to analyze and describe the concentrations of eculizumab and the complement blockade in patients with atypical hemolytic uremic syndrome (aHUS) and C3 glomerulopathy, and to define a therapeutic margin where there is a high probability of achieving therapeutic efficacy.
MethodsObservational, ambispective, and multicenter study that included adult and pediatric patients diagnosed with aHUS and C3 glomerulopathy from September 2020 to October 2022 in 5 hospitals in Spain. Eculizumab was administered at the doses recommended by the data sheet according to the European Medicines Agency (EMA). Pre- and post-dose concentrations of eculizumab were determined, as well as blockade of the classical complement pathway (CH50). Sociodemographic and clinical data were collected, and pharmacokinetic parameters were calculated. To establish the cut-off point for eculizumab concentrations that predicted complement blockade, Receiver Operating Characteristic (ROC) curve analysis was performed. Lastly, the Kruskal–Wallis test was used to contrast the differences in different parameters according to eculizumab concentrations.
ResultsTwenty-five patients were included, 19 adults (76.0%) and 6 pediatrics (24.0%), with median ages of 43.4 (interquartile range (IQR) 35.7–48.8) and 10.1 (IQR 9.6–11.3) years, respectively. Of these, 22 (88.0%) patients were diagnosed with aHUS and 3 (12.0%) with C3 glomerulopathy. A total of 111 eculizumab concentrations were determined. Mean pre- and post-dose concentration values detected during the maintenance phase were 243.8 (SD 240.6) μg/mL and 747.4 (standard deviation (SD) 444.3) μg/mL, respectively. Increased complement blockade was observed at higher pre-dose concentrations (P = .002) and decreased serum creatinine at both higher pre- and post-dose concentrations (P = .001 and P = .017, respectively). Using ROC curves, it was determined that a pre-dose concentration >149.0 μg/mL was optimal to achieve complement blockade, with an AUC of 0.87 (0.78–0.95). Finally, high inter-individual (48.9% variation coefficient (CV)) with low intra-individual variabilities (11.9% CV) in eculizumab clearance were observed.
ConclusionsThe present study reports supratherapeutic concentrations of eculizumab in patients with aHUS, and defines higher concentrations than those described in the data sheet to achieve blockade, thus encouraging the personalization of treatment with eculizumab.
analizar y describir las concentraciones de eculizumab y el bloqueo del complemento en los pacientes con síndrome hemolítico urémico atípico (SHUa) y glomerulopatía C3, y definir un margen terapéutico donde se alcance una alta probabilidad de conseguir eficacia terapéutica.
Métodosestudio observacional, ambispectivo y multicéntrico que incluyó pacientes adultos y pediátricos diagnosticados de SHUa y glomerulopatía C3 desde septiembre de 2020 hasta octubre de 2022 en cinco hospitales de España. Eculizumab se administró a las dosis recomendadas por ficha técnica. Se determinaron las concentraciones pre y post-dosis de eculizumab, así como del bloqueo de la vía clásica del complemento (CH50). Se recogieron variables sociodemográficas, analíticas y clínicas, y se calcularon los parámetros farmacocinéticos. Para establecer el punto de corte de las concentraciones de eculizumab que predecían el bloqueo del complemento se realizó un análisis de curvas ROC (Receiver Operating Characteristic). Se utilizó el test de Kruskal-Wallis para contrastar las diferencias en distintos parámetros según las concentraciones de eculizumab.
Resultadosse incluyeron 25 pacientes, 19 adultos (76,0%) y 6 pediátricos (24,0%), con edades medianas de 43,4 (rango intercuartílico [RIC] 35,7-48,8) y 10,1 (RIC 9,6-11,3) años, respectivamente. De ellos, 22 (88,0%) pacientes fueron diagnosticados con SHUa y 3 (12,0%) con glomerulopatía C3. Se determinaron un total de 111 concentraciones de eculizumab. Las concentraciones predosis y posdosis medias detectadas durante la fase de mantenimiento fueron 243,8 (desviación estándar [SD] 240,6) μg/ml y 747,4 (SD 444,3) μg/ml, respectivamente. Se observó un aumento del bloqueo del complemento a mayores concentraciones predosis (p = 0,002) y una disminución de la creatinina sérica a mayores concentraciones tanto pre como posdosis (p = 0,001 y p = 0,017, respectivamente). Mediante curvas ROC se determinó que una concentración predosis >149,0 μg/ml es óptima para conseguir el bloqueo del complemento, con un AUC de 0,87 (0,78-0,95). Finalmente, se observó una elevada variabilidad interindividual (48,9% coeficiente de variación [CV]), con una menor variabilidad intra-individual (11,9% CV) en el aclaramiento de eculizumab.
Conclusionesel presente estudio reporta concentraciones supraterapéuticas de eculizumab en pacientes con SHUa, y define unas concentraciones superiores a las descritas en ficha técnica para conseguir el bloqueo del complemento, incitando así, a la personalización del tratamiento con eculizumab.
Atypical hemolytic uremic syndrome (aHUS) is a rare form of thrombotic microangiopathy (TMA) arising from deregulation of the complement alternative pathway at the level of the surface of endothelial membrane, thereby causing uncontrolled complement activation.1
aHUS is characterized by a triad of non-autoimmune hemolytic anemia, thrombocytopenia, and acute kidney failure (AKI). Other complications may arise, including damage to various organs, such as the liver, lungs, heart, intestine, and the central nervous system.2,3 In 50%–60% of patients with aHUS, deregulation results from mutations in the genes encoding regulatory proteins of the complement alternative pathway, including factor H, factor I, factor B, C3, thrombomodulin, and membrane cofactor protein (MCP). These mutations favor the persistent activation of the C5b-9 complex, also called membrane attack complex (MAC), thereby resulting in endothelial damage.1,4 Deregulation can also be induced by antibodies against complement proteins, such as factor H, a phenomenon that is most frequently described in pediatric patients (25%–50%), as compared to adults (5%–10%).3,5
C3 glomerulopathy, including dense deposit disease (DDE) and C3 glomerulonephritis (C3GN), is a kidney disease caused by hyperactivation of the complement alternative pathway that induces the formation of C3-dominant glomerular deposits. Deregulation can result either from mutations in regulatory proteins or from the presence of autoantibodies against these proteins. C3 nephritic factor (C3NFs) is the most frequent autoantibody in this disease. The clinical manifestations of the 2 subtypes of C3-glomerulopathy include the presence of micro- or macrohematuria, with different levels of proteinuria, associated with progressive deterioration of kidney function.6
Eculizumab (Soliris®) is a recombinant humanized monoclonal antibody specifically targeted against the complement protein C5 that inhibits the cleavage of C5 by the C5 convertase into C5a (a proinflammatory anaphylatoxin) and C5b. This activity results in impaired cell lysis due to inhibition of MAC generation.7 In aHUS, eculizumab confers a rapid response by which hematological parameters normalize and kidney function improves.8,9 Eculizumab has demonstrated to be also a treatment option for C3 glomerulopathy, although the evidence available is more limited. Thus, this agent has been reported to cause a reduction of proteinuria and the stabilization of kidney function.10–12
To date, the efficacy of eculizumab is primarily assessed using markers of hemolysis (haptoglobin and LDH), platelet count, markers of kidney function, complement hemolytic activity (CH50), and circulating levels of the C3 complement. Despite the scarcity of data on the pharmacokinetics (PK) and pharmacodynamics (PD) of eculizumab, some studies associate eculizumab concentrations with biomarkers of complement activity, such as CH50, which measures total functional status of the classical complement pathway.13,14
According to the EPAR for eculizumab, serum pre-treatment or trough concentrations of 50–100 μg/mL are sufficient for essentially complete inhibition of terminal complement activity and maintenance of sustained free C5 concentrations.7 However, these therapeutic margin is controversial, as some studies report higher concentrations.8,9,13,15–17 In addition, pharmacokinetic studies show the impact of some covariates on the pharmacokinetics of eculizumab, such as weight and C5b9 concentrations.13,15 In the light of the high inter-individual variability of the pharmacokinetic profile of eculizumab, we conducted a study to assess and describe the association between eculizumab concentrations and complement inhibition in patients with aHUS and C3 glomerulopathy. A secondary goal was to determine a therapeutic margin that ensures therapeutic efficacy.
MethodsPatient cohortAn observational, ambispective, multicentric study was conducted from September 2020 to October 2022. The 25 patients included in this study were diagnosed of aHUS or C3 glomerulonephritis and received treatment at Universitari Vall d'Hebron (HUVH, Barcelona) Gregorio Marañón University Hospital (Madrid); Miguel Servet University Hospital (Zaragoza); Doctor Peset hospital (Valencia) and Complejo Hospitalario Universitario de Santiago (Santiago de Compostela). Eculizumab was administered at the doses recommended by the EMA (Supplementary Material 1).7
Blood sample collectionBlood samples were drawn by venous puncture (3–5 mL in pediatric patients and 10 mL in adult patients). All complement determinations (except for C5b9s) were performed using serum fraction. C5b9s was separated from plasma by centrifugation (10 min, 1800–2000 g at room temperature) <4 h after puncture. Each serum and plasma sample was divided in 2 aliquots, which were subsequently frozen at −80 and −20 °C, respectively for 8 months, as recommended by Passot et al.18 Patients were prospectively included (Ecu-prosp) from August 1, 2021. The subjects who initiated eculizumab therapy were included during the induction phase (Ecu-prosp-ind), whereas those who were already receiving maintenance treatment were included during the maintenance phase (Ecu-prosp-mant). Before August 2021, patients were retrospectively included (Ecu-retrosp). In the Ecu-prosp-ind group, blood samples were drawn immediately before the administration of the dose (pre-treatment) and 1 h later (post-treatment, performed at a day hospital to simplify study procedures and reduce patient stay in the hospital for reasons other than receiving standard care) at weeks 3 (CI2.1 y CI2.2); 5 (CI3.1 and CI3.2); 15 (CI4.1 and CI4.2); 29 (CI5.1 and CI5.2); and 55 (CI6.1 and CI6.2). In the Ecu-prosp-mant group, 4 blood samples were drawn (pre- and post-treatment at 2 random time points throughout the treatment, selected at researcher's discretion (CM1.1, CM1.2, CM2.1, and CM2.2). In the Ecu-retrosp group, solely pre-treatment concentrations were available. Blockade of the classical pathway of the complement system (CH50) was monitored in all patients.
Monitoring of eculizumab concentrationsThe methods used for determination of eculizumab and complement system (CH50, sC5b9, and C3) concentrations are summarized in Supplementary Material 2.
Other variables recordedOther variables collected are described in Supplementary Material 3.
PharmacokineticsWhen pre- and post-treatment concentrations at steady-state were available, volume of distribution (Vd), clearance (CL), elimination rate constant (k), and half-life (t1/2) were determined using the following formulas:


Being CSSmax maximum post-treatment concentration (μg/mL); CSSmin, pre-treatment concentration (μg/mL); Tau, dosing interval (in days); k, first-order elimination rate constant (in days−1), and Vd, volume of distribution (in L), and assuming kinetics to be monocompartmental, as reported in the literature.19,20 Finally, intra- and inter-individual variability was calculated. For intra-individual variability to be determined, it was necessary that more than one determination per patient was available.
Statistical analysisContinuous variables were expressed as median and interquartile range (IQR) or as means and standard deviations (SD) and 95% confidence intervals (95% CI). Categorical variables were presented as frequencies and percentages. Comparison of continuous variables was performed using Student t-test or Wilcoxon test, whereas differences in categorical variables were assessed using Chi-square test or Fisher's exact test, as appropriate. An analysis of ROC curves (Receiver Operating Characteristic) was performed to establish the cut-off concentration that predicted complement inhibition. The best cut-off concentration was established based on Youden index. Finally, differences in different parameters according to eculizumab concentration were assessed using the Kruskal–Wallis test. All p values were based on a bilateral hypothesis, and a type I error (P < .05) was considered. Statistical analyses were performed with R 4.2.2 software.
ResultsPatient cohortA total of 25 patients were included, 19 adults (76.0%) and 6 pediatric patients (24.0%), with a median age of 43.4 (IQR 35.7–48.8) and 10.1 (IQR 9.6–11.3) years, respectively. Of them, 22 (88.0%) patients were diagnosed of aHUS and 3 (12.0%) of C3 glomerulopathy, all treated with eculizumab. The baseline characteristics of patients are detailed in Supplementary Material 4.
Eculizumab concentrationsPre-treatment eculizumab concentrations were measured in the 25 patients included (Fig. 1). Three (12.0%) patients were included retrospectively, 13 (52.0%) prospectively, and 9 (36.0%) both, retrospectively and prospectively. Determination was performed of 111 eculizumab concentrations, 11 pre-treatment concentrations and 5 post-treatment concentrations during the induction phase, and 59 pre-treatment concentrations and 36 post-treatment concentrations during the maintenance phase. Mean pre- and post-treatment concentrations were 115.6 (SD 143.3) μg/mL and 472.9 (SD 273.0) μg/mL in the induction phase, and 243.8 (SD 240.6) μg/mL and 747.4 (SD 444,3) μg/mL during the maintenance phase. In the induction phase, eculizumab concentrations increased progressively every 2-week interval by a mean of 90.5 (95% CI: 50.3–157.0) μg/mL.
Association of eculizumab concentrations with other laboratory parameters.")
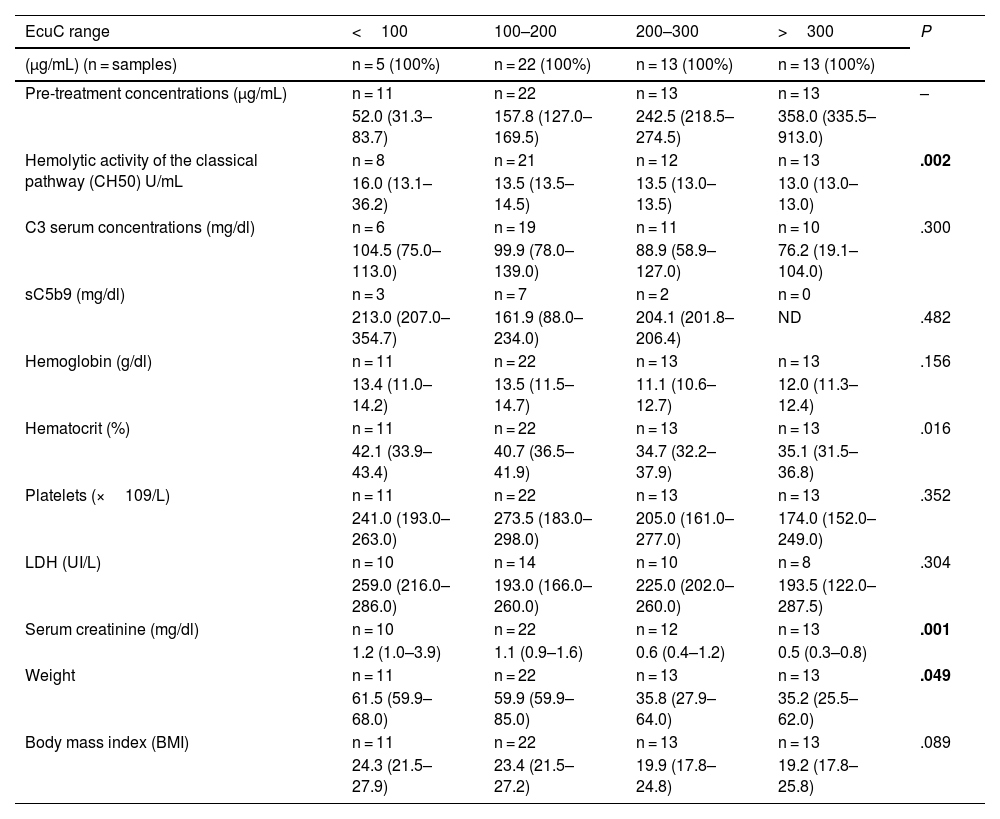
Pre- and post-treatment eculizumab concentrations, shown by concentration range, and their association with other laboratory parameters are shown in Tables 1 and 2, respectively. In relation to pre-treatment concentrations, complement blockade increased as eculizumab concentrations increased (P = .002). Additionally, high eculizumab concentrations were associated with a significant decrease in hematocrit (P = .016), serum creatinine (creatinine decreased at higher concentrations, P = .001) and patient's body weight (P = .049).
Association of pre-treatment eculizumab concentrations with other laboratory parameters (maintenance phase).
| EcuC range | <100 | 100–200 | 200–300 | >300 | P |
|---|---|---|---|---|---|
| (μg/mL) (n = samples) | n = 5 (100%) | n = 22 (100%) | n = 13 (100%) | n = 13 (100%) | |
| Pre-treatment concentrations (μg/mL) | n = 11 | n = 22 | n = 13 | n = 13 | – |
| 52.0 (31.3–83.7) | 157.8 (127.0–169.5) | 242.5 (218.5–274.5) | 358.0 (335.5–913.0) | ||
| Hemolytic activity of the classical pathway (CH50) U/mL | n = 8 | n = 21 | n = 12 | n = 13 | .002 |
| 16.0 (13.1–36.2) | 13.5 (13.5–14.5) | 13.5 (13.0–13.5) | 13.0 (13.0–13.0) | ||
| C3 serum concentrations (mg/dl) | n = 6 | n = 19 | n = 11 | n = 10 | .300 |
| 104.5 (75.0–113.0) | 99.9 (78.0–139.0) | 88.9 (58.9–127.0) | 76.2 (19.1–104.0) | ||
| sC5b9 (mg/dl) | n = 3 | n = 7 | n = 2 | n = 0 | |
| 213.0 (207.0–354.7) | 161.9 (88.0–234.0) | 204.1 (201.8–206.4) | ND | .482 | |
| Hemoglobin (g/dl) | n = 11 | n = 22 | n = 13 | n = 13 | .156 |
| 13.4 (11.0–14.2) | 13.5 (11.5–14.7) | 11.1 (10.6–12.7) | 12.0 (11.3–12.4) | ||
| Hematocrit (%) | n = 11 | n = 22 | n = 13 | n = 13 | .016 |
| 42.1 (33.9–43.4) | 40.7 (36.5–41.9) | 34.7 (32.2–37.9) | 35.1 (31.5–36.8) | ||
| Platelets (×109/L) | n = 11 | n = 22 | n = 13 | n = 13 | .352 |
| 241.0 (193.0–263.0) | 273.5 (183.0–298.0) | 205.0 (161.0–277.0) | 174.0 (152.0–249.0) | ||
| LDH (UI/L) | n = 10 | n = 14 | n = 10 | n = 8 | .304 |
| 259.0 (216.0–286.0) | 193.0 (166.0–260.0) | 225.0 (202.0–260.0) | 193.5 (122.0–287.5) | ||
| Serum creatinine (mg/dl) | n = 10 | n = 22 | n = 12 | n = 13 | .001 |
| 1.2 (1.0–3.9) | 1.1 (0.9–1.6) | 0.6 (0.4–1.2) | 0.5 (0.3–0.8) | ||
| Weight | n = 11 | n = 22 | n = 13 | n = 13 | .049 |
| 61.5 (59.9–68.0) | 59.9 (59.9–85.0) | 35.8 (27.9–64.0) | 35.2 (25.5–62.0) | ||
| Body mass index (BMI) | n = 11 | n = 22 | n = 13 | n = 13 | .089 |
| 24.3 (21.5–27.9) | 23.4 (21.5–27.2) | 19.9 (17.8–24.8) | 19.2 (17.8–25.8) |
CH50: hemolytic activity of the classical pathway; EcuC: eculizumab concentrations; BMI: body mass index NA: not available.
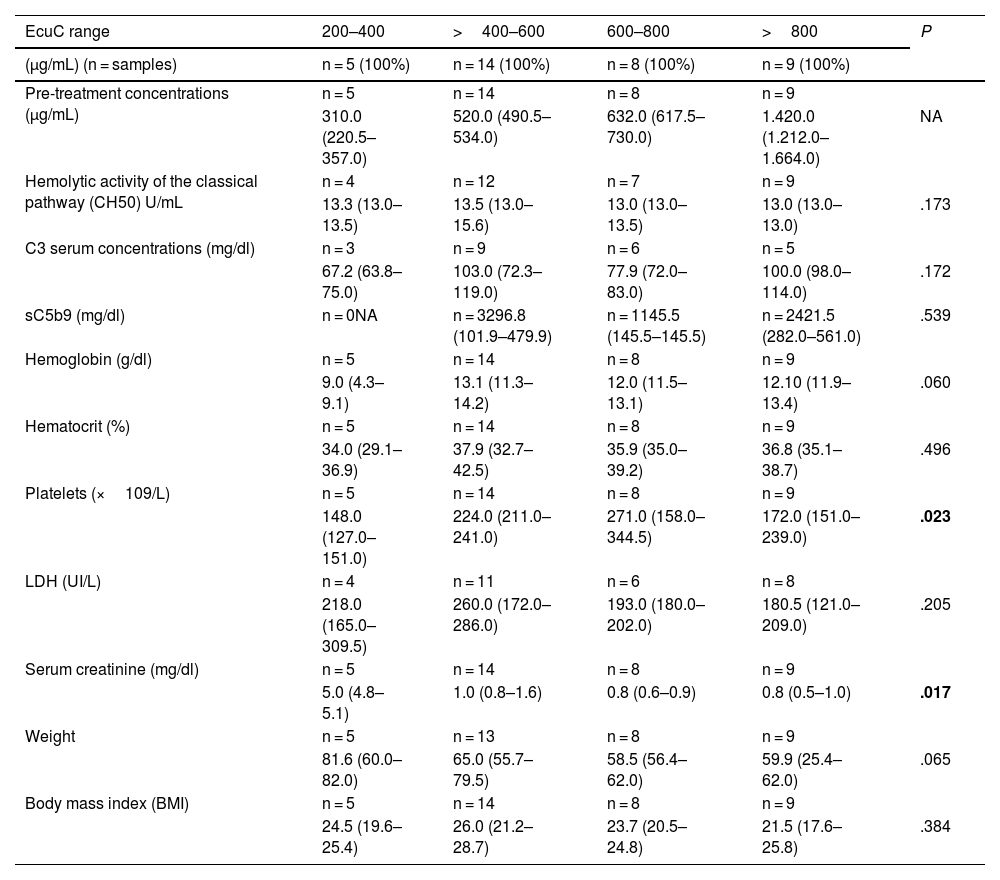
Association of post-treatment eculizumab concentrations with other laboratory parameters (maintenance phase).
| EcuC range | 200–400 | >400–600 | 600–800 | >800 | P |
|---|---|---|---|---|---|
| (μg/mL) (n = samples) | n = 5 (100%) | n = 14 (100%) | n = 8 (100%) | n = 9 (100%) | |
| Pre-treatment concentrations (μg/mL) | n = 5 | n = 14 | n = 8 | n = 9 | |
| 310.0 (220.5–357.0) | 520.0 (490.5–534.0) | 632.0 (617.5–730.0) | 1.420.0 (1.212.0–1.664.0) | NA | |
| Hemolytic activity of the classical pathway (CH50) U/mL | n = 4 | n = 12 | n = 7 | n = 9 | |
| 13.3 (13.0–13.5) | 13.5 (13.0–15.6) | 13.0 (13.0–13.5) | 13.0 (13.0–13.0) | .173 | |
| C3 serum concentrations (mg/dl) | n = 3 | n = 9 | n = 6 | n = 5 | |
| 67.2 (63.8–75.0) | 103.0 (72.3–119.0) | 77.9 (72.0–83.0) | 100.0 (98.0–114.0) | .172 | |
| sC5b9 (mg/dl) | n = 0NA | n = 3296.8 (101.9–479.9) | n = 1145.5 (145.5–145.5) | n = 2421.5 (282.0–561.0) | .539 |
| Hemoglobin (g/dl) | n = 5 | n = 14 | n = 8 | n = 9 | |
| 9.0 (4.3–9.1) | 13.1 (11.3–14.2) | 12.0 (11.5–13.1) | 12.10 (11.9–13.4) | .060 | |
| Hematocrit (%) | n = 5 | n = 14 | n = 8 | n = 9 | |
| 34.0 (29.1–36.9) | 37.9 (32.7–42.5) | 35.9 (35.0–39.2) | 36.8 (35.1–38.7) | .496 | |
| Platelets (×109/L) | n = 5 | n = 14 | n = 8 | n = 9 | |
| 148.0 (127.0–151.0) | 224.0 (211.0–241.0) | 271.0 (158.0–344.5) | 172.0 (151.0–239.0) | .023 | |
| LDH (UI/L) | n = 4 | n = 11 | n = 6 | n = 8 | |
| 218.0 (165.0–309.5) | 260.0 (172.0–286.0) | 193.0 (180.0–202.0) | 180.5 (121.0–209.0) | .205 | |
| Serum creatinine (mg/dl) | n = 5 | n = 14 | n = 8 | n = 9 | |
| 5.0 (4.8–5.1) | 1.0 (0.8–1.6) | 0.8 (0.6–0.9) | 0.8 (0.5–1.0) | .017 | |
| Weight | n = 5 | n = 13 | n = 8 | n = 9 | |
| 81.6 (60.0–82.0) | 65.0 (55.7–79.5) | 58.5 (56.4–62.0) | 59.9 (25.4–62.0) | .065 | |
| Body mass index (BMI) | n = 5 | n = 14 | n = 8 | n = 9 | |
| 24.5 (19.6–25.4) | 26.0 (21.2–28.7) | 23.7 (20.5–24.8) | 21.5 (17.6–25.8) | .384 |
CH50: hemolytic activity of the classical pathway; EcuC: eculizumab concentrations; BMI: body mass index NA: not available.
In relation to post-treatment concentrations, statistically significant differences were observed in creatinine (P = .017), platelet count (the higher the concentration, the higher the count P = .023). However, these increases were no longer observed at doses >800 μg/mL.
No statistically significant differences were observed in relation to C5b9 concentrations.
Adverse drug reactions and duration of eculizumab treatmentOnly an infusion-related reaction was observed in 1 patient.
At the moment of data analysis, eculizumab therapy had been discontinued in 13 patients (52.0%). Reasons for discontinuation included lack of clinical benefit (5); progressive clinical improvement (4); death for a cause other than the treatment (2); need for palliative care (1); and shift to ravulizumab (1). The mean duration of treatment until discontinuation was 11.4 months (1.9–111.2 months). Twelve (48.0%) patients are still receiving eculizumab, after 83.7 (11.1–122.2) months of treatment.
Complement inhibitionSupplementary Material 5 shows the characteristics of patients on the basis of whether they achieved complete complement inhibition (i.e., whether CH50 values were undetectable or not)21 during treatment (in this case and considering the limit of detection of the technique used, CH50≤13.49%).
The ROC curves demonstrated that pre-treatment eculizumab concentrations >149.0 μg/mL are optimal to achieve complement inhibition, attained in 40 (67.8%) samples, with an AUC of 0.87 (0.78–0.95) and a sensitivity and specificity of 80.6 and 78.9%, respectively (Supplementary Material 6). In 5 samples, complement inhibition could not be determined.
PharmacokineticsPharmacokinetics was assessed in 15 patients (all adults with aHUS, except for a patient with C3 glomerulopathy). Intra-individual variability could be assessed in 10 of these patients. Median clearance was 8.7 (6.4–11.2) mL/h, volume of distribution was 3.6 (2.2–5.3) liters, and half-life was 12.3 (10.8–13.0) days. In addition, we observed high inter-individual variability in eculizumab clearance (48.9% CV), whereas intra-individual variability was lower (11.9% CV). The only patient with C3 glomerulopathy in whom pharmacokinetics could be assessed showed a clearance of 11.9 mL/h, a volume of distribution of 2.2 L, and a half-life of 5.4 days.
DiscussionThis study was conducted to determine and describe eculizumab concentrations in patients with aHUS and C3 glomerulopathy and establish an optimal therapeutic margin to achieve therapeutic efficacy (i.e., complete blockade of the complement). Overexposure was observed in most patients with aHUS, considering the therapeutic margin of a target pre-treatment concentration of 50–100 μg/mL, established in the EPAR.7
Based on the results obtained, eculizumab concentrations exceeded those considered to be within therapeutic margin according to the EPAR.7 This finding has been previously reported by other authors. Thus, Gatault et al. reported that 8 in 9 patients exhibited mean pre-treatment concentrations of eculizumab >100 μg/mL and 5 patients showed concentrations >300 μg/mL.13 The pilot study carried out by Reiss et al. revealed pre-treatment eculizumab concentrations >100 μg/mL in all patients, with high intra-individual variability.16 Volokhina et al. observed that the 11 patients included had concentrations of 36–459 μg/mL (n = 27) and 40–772 μg/mL (n = 90) during the induction and maintenance phases, respectively.17 Greenbaum et al. documented pre-treatment eculizumab concentrations >50 μg/mL (both, in the induction and maintenance phase) in the 22 patients included in their study, with post-treatment values <700 μg/mL.9 Finally, Passot et al. reported that all the 40 patients included had eculizumab concentrations ≥100 μg/mL, with concentrations ranging from 124 ± 9 to 1065 ± 121 μg/mL.15
The results obtained in our study on the association of eculizumab concentrations and complement inhibition during the maintenance phase consistently show that these concentrations exceed the standard, with a cut-off of 149.0 μg/mL. Jodele et al. reported that when eculizumab concentrations were >30 μg/mL, CH50 activity in enriched serum showed a plateau of CH50 inhibition.20 Volokhina et al. observed that all samples with eculizumab concentrations ≥50 μg/mL showed adequate complement inhibition (CH50≤12%).17
The results of this study show an inverse relationship between eculizumab concentrations and the effect of body weight. This finding is consistent with the results of previous studies, such as that conducted by Gatault et al. where weight was found to be the determining factor of observed inter-individual variability.13 In addition, clearance was lower and half-life was higher in patients with a lower body weight and a higher half-life, an effect frequently associated with other antibodies.22
In relation to genetic studies, carriers of MCP and CFI mutations had an improved prognosis, as compared to patients with pathogenic CFH variants, being the latter the most frequently reported mutations.4 Haplotypic homozygosity of the CHH (CFH tgtgt) and MCP (MCPggaac) genes has been demonstrated to be associated with a higher risk for aHUS.23 However, to date, the impact of pharmacogenetics on exposure to and pharmacokinetics of eculizumab has not yet been evaluated. In our cohort, complement genetic testing confirmed the presence of pathogenic variants, more specifically in the CFH, MCP, and CFI genes, in 29.4% of patients. Additionally, 70.6% had one or more aHUS risk polymorphisms in the CFH and/or MCP genes, 7 in homozygosity.
An inverse relationship was also observed between serum creatinine and pre- and post-treatment eculizumab concentrations, which reflects a potential improvement of kidney function. The hematocrit decreased as eculizumab concentrations increased, with optimal concentrations for the normalization of the hematocrit ranging from 100 to 200 μg/mL. The same occurred with hemoglobin and platelet count, although differences were not statistically significant. However, these findings might be considered an adverse effect of high eculizumab concentrations (with anemia and thrombocytopenia having been reported as adverse drug reactions in clinical trials).
Considering post-treatment concentrations, a direct relationship was observed between platelet count and post-treatment concentrations. Thus, high eculizumab concentrations are associated with an improvement in the hematological manifestations of the disease (in this case, post-treatment). Based on pre-treatment concentrations, an improvement was not observed in hematological parameters when concentrations were in the upper limit (>800 μg/mL). This finding led us to establish the optimal concentration range below that range (400–600 μg/mL for hemoglobin and the hematocrit and 600–800 μg/mL for platelet count). No statistically significant differences were observed either in pre- or post-treatment sC5b-9 concentrations, assumingly due to the low number of patients who underwent sC5b-9 testing. Volokhina et al. reported that eculizumab concentrations decreased below the target therapeutic margin 1 week after the first infusion in 2 patients with high baseline sC5b-9 concentrations.17 Jodele et al. documented that initial clearance of eculizumab was faster in patients with higher baseline sC5b-9 concentrations.20 Of note, a recent study revealed that eculizumab can bind to sC5b-9 in-vitro, which suggest that partial clearance of this agent may occur in a sC5b-9 complex in the first infusion.24 Fakhouri et al. reported that higher sC5b-9 concentrations at discontinuance of eculizumab were independently associated with aHUS relapse risk.25 For unclear reasons, SC5b-9 remained detectable in a significant proportion of patients despite optimal C5 blockade. This finding suggests C5 cleavage via other pathways different from the C5 convertase.24,26–29
Finally, we observed a high inter-individual variability in eculizumab clearance (48.9% CV), whereas intra-individual variability was lower (11.9% CV). Ter Avest et al. observed a higher intra-individual variability of 34.4%, which they explained by variations in the volume of C5 available, for example due to infections.30 In relation to pharmacokinetics, the median clearance in the study patients was 8.7 (6.4-11.2) mL/h; median volume of distribution was 3.6 (2.2–5.3) l; and median half-life was 12.3 (10.8–13.0), which are consistent with the values reported in the EPAR for eculizumab.7
This study has some limitations. Firstly, the number of patients with C3 glomerulopathy was very limited; therefore, conclusive results cannot be drawn on this population of patients. Anyway, it was assumed that the behavior of this agent could resemble that observed in patients with aHUS. Secondly, the lower limit of detection of the technique used for monitoring complement blockade was 13.49%, as compared to 10% reported in previous studies. However, the 2 limits make it possible to differentiate optimal from suboptimal values of complement blockade induced by eculizumab. Finally, more samples could not be obtained at time points other than pre- and post-treatment. This would have facilitated the characterization of eculizumab pharmacokinetics and determination of inter- and intra-individual variability. However, this enabled the inclusion of a higher number of patients, since participation in the study did not involve undergoing further procedures other than those included in standard care.
In conclusion, this study describes eculizumab pharmacokinetics in patients with aHUS and C3 glomerulopathy and establishes higher optimal concentrations to achieve complement blockade than those reported on the EPAR. To definitely determine the efficacy of eculizumab and personalize treatments, it is necessary that population pharmacokinetic models or algorithms are designed including eculizumab concentrations, CH50 blockade, body weight, and sC5b9 concentrations. Optimization of eculizumab dosing based on the monitoring of pharmacokinetics can only be achieved through close follow-up, which will ensure treatment efficacy.
Ethical considerationsThe study protocol was approved by the Ethics Committee of Hospital Universitari Vall d'Hebron (protocol code EPA(AG)01/2020(5579).
FundingThis study was carried out with funds granted by the Spanish Foundation of Hospital Pharmacy (FEFH) and the Spanish Society of Hospital Pharmacy (SEFH) via the 2020–2021 call for grants for working groups.
AuthorshipMarta Miarons, Alba Pau Parra and Natalia Ramos contributed to study design and conception; Alba Pau Parra, Natalia Ramos, Silvia Manrique-Rodríguez, Monica Climente, Laura García Quintanilla, Ángel Escolano and Marta Miarons contributed to patient selection and data collection; data analysis and interpretation were carried out by Alba Pau Parra, Janire Perurena-Prieto and Marta Miarons; Alba Pau Parra and Marta Miarons drafted the manuscript. All authors reviewed critically and contributed to improve the manuscript and approved the final version for publication.
Contribution to the scientific literatureThis study describes eculizumab pharmacokinetics in patients with aHUS and C3 glomerulopathy and reveals higher concentrations than those documented, and establishes pre-treatment concentrations >149.0 μg/mL as optimal to achieve complement blockade.
The results obtained demonstrate that complement blockade increases at higher pre-treatment concentrations, and serum creatinine decreases at higher pre- and post-treatment concentrations. Finally, we observed a high inter-individual variability in eculizumab clearance, whereas intra-individual variability was lower.
Supplementary material.

