

Sirolimus is used in the immunosuppressive therapeutic treatment of kidney transplant patients. The high pharmacokinetic variability of sirolimus makes pharmacokinetic monitoring and dosage individualization of immunosuppressive therapy a key process to achieve better efficacy results. The availability of a population pharmacokinetic model can be used to provide better pharmacokinetic adjustment of plasma concentrations of sirolimus and thus achieve greater clinical benefit.
MethodWe conducted a systematic review of the literature available in the Medline, Embase, and Scopus databases to identify and subsequently analyze population pharmacokinetic models of orally administered sirolimus in adult patients after kidney transplant. The descriptors used MeSH were kidney transplantation, pharmacokinetics, and sirolimus. The following variables from the selected studies were assessed: study population, immunosuppressive treatment, blood sampling times, covariates analyzed, type of pharmacokinetic model, computer software used, estimated pharmacokinetic parameters, interindividual variability of pharmacokinetic parameters, residual variability and mathematical equations of the pharmacokinetic model.
ResultsA total of 548 results were obtained, excluding 175 records that were identified in more than one database. Finally, seven articles that met the inclusion criteria were selected. Most of the pharmacokinetic models found fit a two-compartment model. The interindividual variability of sirolimus was explained by covariates such as age, weight, liver function, cyclosporine exposure and dose, sirolimus doses, CYP3A5 genetic polymorphisms, serum creatinine, and concomitant treatment.
ConclusionsThe two-compartment model was the pharmacokinetic model of choice in most of the selected studies. The interindividual variability of the pharmacokinetic parameters of sirolimus is explained by demographic, clinical, genetic, and biochemical variables. The availability of pharmacokinetic models of sirolimus can assist in optimizing therapy in patients after kidney transplant.
Sirólimus es un fármaco utilizado en los esquemas terapéuticos inmunosupresores en pacientes con trasplante renal. La elevada variabilidad farmacocinética de sirólimus hace que la monitorización farmacocinética y la individualización posológica de la terapia inmunosupresora sea un proceso crucial para conseguir mejores resultados de eficacia. La disponibilidad de un modelo farmacocinético poblacional permite realizar un mejor ajuste farmacocinético de las concentraciones plasmáticas de sirólimus y así conseguir un mayor beneficio clínico.
MétodoSe realizó un análisis sistemático de la literatura disponible en las bases de datos Medline, Embase y Scopus para identificar y posteriormente analizar los modelos farmacocinéticos poblacionales de sirólimus administrado por vía oral en pacientes adultos con trasplante renal. Se utilizaron como descriptores MeSH: kidney transplantation, pharmacokinetic y sirolimus. De cada artículo seleccionado se evaluó: la población a estudio, el esquema de tratamiento inmunosupresor, los tiempos de muestreo de las extracciones de sangre, las covariables analizadas, el tipo de modelo farmacocinético, el programa informático utilizado, los parámetros farmacocinéticos estimados, la variabilidad interindividual de los parámetros farmacocinéticos, la variabilidad residual y las ecuaciones matemáticas del modelo farmacocinético.
ResultadosSe obtuvieron un total de 548 resultados, excluyendo 175 registros tras identificarse en más de una base de datos. Finalmente se seleccionaron siete artículos que cumplían los criterios de inclusión. La mayoría de los modelos farmacocinéticos encontrados siguen un modelo bicompartimental. Covariables como edad, peso, función hepática, exposición y dosis de ciclosporina, dosis de sirólimus, polimorfismos genéticos del CYP3A5, creatinina sérica y tratamiento concomitante explican la variabilidad interindividual de sirólimus.
ConclusionesEl modelo bicompartimental fue el modelo farmacocinético de elección en la mayoría de los estudios seleccionados. La variabilidad interindividual de los parámetros farmacocinéticos de sirólimus se explica por variables demográficas, clínicas, genéticas y bioquímicas. La disponibilidad de modelos farmacocinéticos de sirólimus permiten individualizar la terapia en pacientes con trasplante renal.
Renal transplant is the treatment of choice for end-stage renal disease1. Patients undergoing renal transplant need treatment with immunosuppressive therapy to prevent acute rejection and allograft loss. After transplantation, immunosuppressive treatment should be closely followed-up because these patients are more susceptible to infections, malignant neoplasms, or cardiovascular disease; comorbidities related to the underlying renal disease should be carefully monitored2.
In therapeutic schemes, the main immunosuppressive agents used in combination are glucocorticoids, mycophenolate mofetil, cyclosporine, everolimus, tacrolimus, and sirolimus. Standard pharmacological treatment is based on a combination of immunosuppressive drugs with different mechanisms of action3,4. This strategy minimizes the morbidity and mortality associated with each type of drug while enhancing overall efficacy. Such schemes may vary according to patient characteristics, transplant centre, or geographic area.
Sirolimus has high pharmacokinetic variability, which leads to marked differences in drug exposure in patients receiving the same dose5. In this context, a key and necessary process is the individualization of the dosage of immunosuppressive therapy based on pharmacokinetic monitoring to achieve the best results in terms of maximizing efficacy and safety, avoiding acute rejection, minimizing the adverse effects derived from treatment, and controlling other factors that alter the pharmacokinetic profile of the drugs, such as interactions, lack of adherence to treatment, or genetic polymorphisms.
In fact, there is a close association between exposure to sirolimus and efficacy and the appearance of adverse effects6. This relationship between the degree of drug exposure and safety and efficacy requires close monitoring of sirolimus plasma concentrations. It is relevant to know the factors that affect the interindividual pharmacokinetic variability of sirolimus in order to achieve the optimal individualization of drug therapy. Thus, the availability of population pharmacokinetic models of sirolimus can be used to estimate individual pharmacokinetic parameters using Bayesian methodology and make individualized pharmacokinetic adjustments to sirolimus dosing regimens, thereby achieving higher efficacy of therapy, lower rejection rates, and the lowest possible toxicity.
The aim of the present study was to conduct a systematic review of the published scientific literature on the available population pharmacokinetic models of sirolimus in renal transplant patients.
MethodsWe designed a cross-sectional descriptive study and critical analysis of the scientific articles found through a systematic review. Data were obtained from the following databases: Medline (via Pubmed), Embase, and Scopus.
The bibliographic search terms were defined by consulting the Thesaurus developed by the U.S. National Library of Medicine. The following descriptors were considered suitable MeSH: kidney transplantation, pharmacokinetics, and sirolimus. The final search equation was designed to be used in the Medline database via Pubmed using Boolean operators:
((“sirolimus”[MeSH Terms] OR “sirolimus”[Title/Abstract]) AND (“Pharmacokinetics”[MeSH Terms] OR “Pharmacokinetic”[Title/Abstract]) AND (“Kidney Transplantation”[MeSH Terms] OR “Kidney Transplantation”[Title/Abstract]).
This strategy was also designed to be used in the other databases consulted. The search was conducted until May 2021. In addition, we reviewed the scientific articles referenced by the studies selected in the final search to reduce possible publication bias. Any study found by this route was included as a manual search.
Inclusion criteria were as follows: original studies that met the objectives of the search (i.e. population pharmacokinetic models of oral sirolimus in adult renal transplant patients) that were published in peer-reviewed journals and written in English and Spanish. In addition, we included articles that could be retrieved as full text. We excluded studies that included paediatric patients as the study population and those that were not performed in humans. We also excluded communications to congresses to avoid possible duplication.
The following variables from the selected studies were assessed: study population, immunosuppressive treatment schedule, post-transplant time, blood sampling times, covariables analyzed, type of pharmacokinetic model, computer software used, estimated pharmacokinetic parameters (relative standard error), interindividual variability of pharmacokinetic parameters, residual variability, and mathematical equations of the pharmacokinetic model.
ResultsThe search of the three databases yielded a total of 548 results. A total of 175 records were excluded after being identified in more than one database. Finally, eight were assessed, of which one was excluded because it was a pharmacokinetic model of sirolimus as an intravenous temsirolimus metabolite (Figure 1). No results were obtained from the manual search.

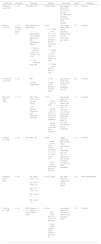
Table 1 shows the characteristics of the studies reviewed. Of the seven studies that met the inclusion criteria, five were retrospective studies (Wang et al.8, Golubovic et al.7, Dansikirul et al.12, Zimmerman et al.9, and Jiao et al.10) and two were prospective. The studies by Jiao et al.10, Wang et al.8, and Ferron et al.13 were multicentre studies and the rest were single-centre studies.
Characteristics of the articles selected in the systematic review
| Author/Year | Population | IS scheme | Samples | Covariates | Model | Software |
|---|---|---|---|---|---|---|
| Golubovic et al.7 2019 | n = 25 | SIR + MM + CO | n = 250 Trough | Age, weight, SCR, HTO, TP, TCh, TG, AST, ALT, AP, MM dose, CO dose, gender, DO, pre-tx dialysis | 2C | Nonmem |
| Wang et al.8 2016 | n = 22 (Healthy) n = 105 (Renal Tx) | Data obtained from three studies.
| n = 623
| Age, weight, height, BMI, gender, population, doses of CsA, Pc CsA, BUN, SCR, ALT, SBR | 2C | Nonmem |
| Zimmerman et al.9 2016 | n = 27 |
|
| Age, weight, SCR, HTO, gender, race, ≥ 1 drug interacting with SIR | 2C | Nonmem |
| Zhen Jiao et al.10 2009 | n = 112 |
| n = 804
| Age, weight, height, SC, BMI, days post-tx, SIR dose, CsA dose, Pc CsA, HDL, LDL, TC, TG, erythrocytes, leukocytes, OHT, Hb, BUN, Cr, CrCl, ALT, AST, gender, DO, co-medication | 1C | Nonmem |
| Djebli et al.11 2006 | n = 22 | SIR + MM + CO | n = 938
| Weight, height, age, BMI, sex, SC, HTO, erythrocytes, Hb, leukocytes, AST, ALT, TCh, TG, platelets, TP, Alb, U, SCR, CYP3A5, CYP3A4 and MDR1 genotypes | 2C | Nonmem |
| Dansirikul et al.12 2005 | n = 25 |
| n = 315 Trough | Age, SBR, Alb, HTO, weight, days post-tx, gender | 2C | PKBUGS/WinBUGS |
| Ferron et al.13 1996 | n = 36 | SIR (3 doses: 3, 5, 10, 15 mg/m2) + CsA (± PRED, AZA) | n = 636
| Age, weight, height, SC, SIR dose, Pc, CsA on day 1, and study centre | 2C | P-Pharm |
1C: one-compartment; 2C: two-compartment; Alb: albumin; ALT: alanine transaminase; AP: alkaline phosphatase; AST: aspartate transaminase; AZA: azathioprine; BMI: body mass index; BUN: blood urea nitrogen; CO: corticosteroids; CrCl: creatinine clearance; CsA: cyclosporine; DO: donor origin; HDL: high density lipoproteins; HTO: hematocrit; IS: immunosuppressant; LDL: low density lipoproteins; MM: mycophenolate; Pc: plasma concentration; PRED: prednisone; SBR: serum bilirubin; SCR: serum creatinine; SIR: sirolimus; TA: tacrolimus; TCh: total cholesterol; TG: triglycerides; TP: total proteins; U: urea.
Of the prospective studies, Ferron et al.13 conducted a phase I randomized double-blind placebo-controlled trial which assessed the doserelated pharmacokinetics of sirolimus (single dose of sirolimus 3, 5, 10, and 15 mg/m2). Djebli et al.11 assessed the pharmacokinetics of sirolimus during the first 3 months post-transplant, data were collected prospectively, and analyses was performed retrospectively. Of the retrospective studies, Jiao et al.10 analyzed data from a nonrandomized sequential two-phase study to assess the pharmacokinetics of sirolimus and the influence of cyclosporine (Phase 1: cyclosporine dose reduction; Phase 2: cyclosporine discontinuation elimination) during the first 12 months post-transplant. Wang et al.8 described the pharmacokinetics of sirolimus in healthy adults and renal transplant recipients. Golubovic et al.7, Dansikirul et al.12, and Zimmerman et al.9 developed a pharmacokinetic model of sirolimus using clinical routine data that were obtained retrospectively.
The studies by Jiao et al.10 and Djebli et al.11 included de novo renal transplant recipients at 12 and 3 months post-transplant, respectively. However, the study by Ferron et al.13 included patients with stable transplantation, compromised renal function, and high risk of rejection. The study assessed the pharmacokinetics after single oral administration of sirolimus. The study by Goluvobic et al.7 included data on sirolimus (used as a second-line immunosuppressant) obtained over a 1-year period from the initiation of drug treatment. Post-transplant follow-up time was not specified. Similarly, Dansikirul et al.12 and Zimmerman et al.9 included very heterogeneous patients, using a median post-transplant time of 278 months (2 days-10.7 years) and 49 months (0-202 months), respectively. Wang et al.8 included healthy volunteers (bioavailability study) and renal transplant patients (Phase II and post-marketing study), without specifying the post-transplant follow-up time.
Table 1 shows that the immunosuppression schedules of the study patients were heterogeneous. The combination of treatments included calcineurin inhibitors (cyclosporine, tacrolimus), antimetabolites (azathioprine, mycophenolate), and corticosteroids. The study by Zimmerman et al.9 did not specify the immunosuppressive regimen used in the patients. The sirolimus dosing schedule and target therapeutic range described in the included studies were as follows: Golubovic et al.7: 12-20 mg on day 1 plus simultaneous de-escalation of the first-line calcineurin inhibitor, followed by 4-8 mg (from day 2 to 5) and subsequent doses according to trough plasma concentrations (8-20 ng/mL); Djebli et al.11: 15 mg/d on day 1 and 2 post-transplant followed by 10 mg/d for 7 days, subsequently adjusted according to plasma concentrations (10-15 ng/mL); Jiao et al.10: 6 mg on day 1, followed by 2 mg/d, subsequently adjusted according to plasma concentrations (6-12 ng/mL); Ferron et al.13: single doses of 3, 5, 10 and 15 mg/m2 were assessed in patients on treatment with steady-state doses of cyclosporine.
The dosing schedule was not specified in the studies by Dansikirul et al.12, Zimmerman et al.9, and Wang et al.3. In these studies, the reported doses were as follows: 6 ± 3 mg/d (mean ± standard deviation, range: 2-20 mg/d), 2 mg/d (median, range: 1-6 mg/d), and a dose range of 0.5 to 2 mg/d, respectively. The therapeutic interval established by Dansikirul et al.12 was 4 to 12 µg/L or 12 to 20 µg/L depending on whether or not the scheme included cyclosporine, respectively. In the study by Wang et al.3 the therapeutic interval was 4-10 µg/L and in the study by Zimmerman et al.9 it varied according to the post-transplant time (0-4 months post-transplant: 10-15 m µg/L; 4-12 months post-transplant: 16-24 µg/L; >12 months post-transplant: 12-20 µg/L).
Table 1 shows the sampling times. In three of the studies3,11,13 the pharmacokinetic analysis was conducted using full concentration-time curves, whereas in the remaining four studies7,9,10,12 the pharmacokinetic models were developed based on trough concentrations (pre-dose).
In six of the studies, a two-compartment model best fitted the data; only in the study by Jiao et al.10 was a single-compartment model used. In five of the studies the data were analyzed using NONMEM software (Icon Development Solutions, Ellicott City, USA), Ferron et al.13 used P-Pharm software (SIMED Scientific Software, Cedex, France), and Dansikirul et al.12 used WinBUGS software (MRC Biostatistics Unit, Cambridge, UK).
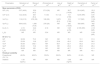
Table 2 shows the typical values of the pharmacokinetic parameters and their estimation error (relative standard error, RSE), interindividual variability, and residual variability. Table 3 shows the mathematical equations and the covariates that explain the interindividual variability of the pharmacokinetic parameters. Most of the studies included the following covariates: age, weight, gender, height, body surface area (BSA), body mass index (BMI), cholesterol, triglycerides, alanine aminotransferase (ALT), aspartate aminotransferase (AST), and the doses and exposure to concomitant immunosuppressants. Only the study by Djebli et al.11 included CYP3A4, CYP3A5, and MDR1 genetic polymorphisms as covariates. The model developed by Golubovic et al.7 shows that the apparent clearance (Cl/F, where F = bioavailability) of sirolimus is influenced by age and liver function (AST). The final model of Wang et al.3 showed that Cl/F significantly decreased with increasing cyclosporin daily dose and age. In addition, the apparent peripheral volume of distribution (Vp/F) increased nonlinearly with increasing serum creatinine. Zimmerman et al.9 identified age as a covariate of Cl/F. Jiao et al.10 found an association between decreased Cl/F and the use of silymarin and glycyrrhizin (contained in hepatoprotective medicinal plants), the trough concentration of cyclosporine, and the total cholesterol level: however, the sirolimus dose increased Cl/F in a non-linear manner. The model of Djebli et al.11 showed an association between CYP3A5*1/*3 polymorphism and an increase in Cl/F. Dansirikul et al.12 included age as a covariate inversely proportional to Cl/F. Finally, the study by Ferron et al.13 found a correlation between Vp/F and intercompartmental clearance (Q/F) and BSA and weight.
Population pharmacokinetic parameters estimated in the studies, interindividual variability, and residual variability
| Parameters | Golubovic et al.7 | Wang et al.8 | Zimmerman et al.9 | Jiao et al.10 | Djebli et al.11 | Dansirikul et al.12 | Ferron et al.13 |
|---|---|---|---|---|---|---|---|
| Mean parameters (RSE) | |||||||
| Q/F (L/h) | 5.07 (48.9) | 32.9 (4.5) | 27.8 (39) | NR | 38.7 (14.99) | 20.4 (NR) | 25.2 (NR) |
| Cl/F (L/h) | 12.2 (20.8) | 8.81 (6.4) | 7.4 (9) | 10.1 (3) | 14.1 (7.09) | 12.94 (NR) | 8.91 (NR) |
| Vc/F (L) | 118 (2.15) | 676 (38) | 128 (29) | 3,670 (9.3) | 218 (7.06) | 117 (NR) | 112.9 (NR) |
| Vp/F (L) | 609 (6.35) | 1,380 (10.6) | 278 (29) | NR | 292 (10.03) | 583 (NR) | 452 (NR) |
| Ka (h-1) | 2.19 (0.0022) | 0.24 (7.1) | 2.18 | NR | 5.25 (4.76) | 2.195 (NR) | 2.18 (NR) |
| t0 (h) | NR | NR | 0.24 | NR | NR | NR | 0.24 (NR) |
| IIV (CV, %) | |||||||
| Q/F | 32.09 | 75.3 | NR | NR | 78.1 | 10.1 | 31.9 |
| Cl/F | 23.39 | 13.6 | 22.7 | 23.8 | 49.3 | 43.6 | 38.2 |
| Vc/F | 55.30 | 302.1 | NR | 56.7 | 52.7 | 55.2 | 31.8 |
| Vp/F | 25.63 | 15.2 | NR | NR | 20.2 | 25.6 | 26.4 |
| Ka | 38.08 | NR | NR | NR | 42.7 | 38.1 | 41.3 |
| t0 (h) | NR | NR | NR | NR | NR | NR | 40.1 |
| Residual variability | |||||||
| Proportional (CV, %) | 49.9% | 65.2% | 33.8% | 29.9% | 242% | 61.4% | NR |
| Additive | 1.93 (ng/mL) | NR | NR | NR | 3.08 (ng/ml) | NR | NR |
Cl/F: apparent clearance; IIV: interindividual variability (coefficient of variation (CV) %); Ka: absorption constant; NR: not reported; Q/F: intercompartmental apparent clearance; RSE: relative standard error; t0: latency time; Vc/F: central volume of distribution; Vp/F: peripheral volume of distribution.
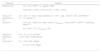
Mathematical equations of the models
| Reference | Equation |
|---|---|
| Golubovic et al.7 |
|
| Wang et al.8 | CL/F = 8.81 × [1 – 0.219 × (Dose CsA/300)] × [1 – 0.0171 × (age – 40)] Vc/F = 676 × (SCR/592.3)1.4 |
| Zimmerman et al.9 | CL = 7.4 × (age/59)−1.02 |
| Jiao et al.10 |
|
| Djebli et al.11 | Cl/F = 14.1 + 14.2 × CYP3A5 |
| Dansirikul et al.12 | Ln (Cl) = 2.827 – 0.2987(age/44) |
| Ferron et al.13 | Cl = – 1.55 + 0.352 × Weight
|
AST: aspartate transaminase; CsA: cyclosporine; CtroughCsA: CsA trough concentrations: total cholesterol; DDS: daily dose sirolimus; GLC: glycyrrhizin; SCR: serum creatinine; SIR: sirolimus; SLM: silymarin.
Sirolimus is a widely used drug in the prophylaxis of solid organ rejection. It has high inter- and intra-patient pharmacokinetic variability, thus requiring periodic pharmacokinetic monitoring to adjust the dosing regimen. In the present review, the search strategy identified seven pharmacokinetic models in the literature. The cutoff for the review was May 31, 2021.
In most of the selected studies, a two-compartment model with linear elimination was the pharmacokinetic model that best fitted the data on plasma concentrations of sirolimus as a function of time. It should be noted that only in the studies by Wang et al.8, Djebli et al.11, and Ferron et al.13 were full concentration-time curves (i.e., multiple concentrations extracted at different times after one dose per patient) available for the development of the pharmacokinetic model.
In the studies reviewed, the Cl/F values ranged from 7.4 to 14.1 L/h with no relationship in the results obtained between the models developed as a function of the amount of sampling time available in each study (full curves vs troughs alone), the sample size, or the time post-transplant (immediate transplant vs stable patients).
The sirolimus distribution volumes obtained in the seven studies were high, indicating a significant distribution of sirolimus in tissues. The values determined by the authors of the studies differed markedly from each other. Jiao et al.10 obtained a Vd/F of 3,670 L with an interindividual variability of 56.7%, which was much higher than that found in the other studies (range: 117-676 L). This result may be due to the use of samples taken at trough time points, which are not ideal samples for estimating distribution parameters. However, trough concentrations alone were also the only ones available in the studies by Golubovic et al.7 and Dansikirul et al.12. In these studies, the values of some pharmacokinetic parameters from the study by Ferron et al.13 as “a priori” values using the “PRIOR” function were used in order to determine all the pharmacokinetic parameters of a two-compartment model. This approach would explain the lower Vc/F than that found in the study by Jiao et al.10. On the other hand, the values of the absorption constant (Ka) show that sirolimus has rapid absorption. Some studies7,9,10 fixed the value of this constant based on the value obtained in other studies due to the lack of samples-times in the absorption phase.
In the selected studies, different covariables were identified that explain some of the interindividual variability of the pharmacokinetic parameters of sirolimus. For example, most of the studies showed the clinical relevance of the variable age. Age is a factor usually assessed in pharmacokinetic studies because it affects the physiological and pathophysiological characteristics of the population, which leads to changes in drug pharmacokinetics. Age was assessed as a covariate in all the studies, but only 4 of them7–9,12 found an inverse relationship between age and Cl/F. This result may be because the age distribution of the population included in the other studies was very homogeneous and therefore this association was not observed.
According to Djebli et al.11, the CYP3A5 genetic polymorphism significantly influences the Cl/F of sirolimus because it is a substrate of this enzyme14. Thus, homozygous patients with the CYP3A5*3*3 polymorphism have a lower Cl/F than patients with the CYP3A5*1*1 and CYP3A5*1*3 polymorphisms, with Cl/F being twice as high in the latter (14.1 L/h vs 28.3 L/h). However, given the limited sample size of this study, other studies with a larger sample size would be needed to support its results. Previous authors15,16 have also assessed the influence of CYP3A5 and CYP3A4 isoenzyme polymorphism on sirolimus pharmacokinetics. Both studies found a relationship between the two polymorphisms, although neither of these studies aimed to develop a pharmacokinetic model.
Weight has an influence on distribution parameters because of the lipophilic nature of sirolimus, which has a high partition coefficient and is partly distributed in fatty tissues. Ferron et al.13 found a correlation between body weight and BSA and apparent intercompartmental clearance (Q/F) and Vp/F.
In the model developed by Jiao et al.10, the sirolimus dose increased the Cl/F of sirolimus in a non-linear manner, which, according to the authors, is explained by the low bioavailability of the drug. Neverthless, it is inadvisable to model Cl/F as a function of dose when the data used are obtained from a targeted monitoring therapy, since the correlation between sirolimus dose and Cl/F occurs because the doses are adjusted to obtain concentrations within a target range. Moreover, in the same model, the decrease in the Cl/F of sirolimus in patients with elevated total cholesterol levels could be explained by the reduction of the free fraction of sirolimus available to be metabolized.
On the other hand, Jiao et al.10 also found that the administration of silymarin and glycyrrhizin as concomitant treatment reduced the Cl/F of sirolimus by 34%. This effect could be explained by the inhibition of CYP3A4 and P-glycoprotein shown by both substances in vitro17,18.
The interaction between cyclosporine and sirolimus has been studied in 2 of the pharmacokinetic models, but with little clinical impact, given that Jiao et al.10 observed a 4.5% decrease in the Cl/F of sirolimus for every 100 ng/mL increase in the plasma concentration of cyclosporine, and Wang et al.8 observed a 7.3% decrease in the CL/F of sirolimus for every 100 mg increase in the daily dose of cyclosporine. This association is in line with the results of the study by Zahir et al.19, in which the clearance of sirolimus decreased by 20.8% per 100 mg increase in cyclosporine dose. Previous authors20 have observed an interaction between cyclosporine and sirolimus at the level of absorption in healthy volunteers, with the area under the curve of sirolimus increasing by 230%. However, it should be taken into account that current guidelines21,22 recommend immunosuppression schemes that include triple therapy with (1) calcineurin inhibitors (tacrolimus being the drug of choice), (2) mycophenolate or mTOR inhibitor, and (3) corticosteroids. Currently, cyclosporine is little used in renal transplant programs. However, most of the population pharmacokinetic models included in the current review were based on schemes in which cyclosporine was included as an anticalcineurinic; only the model developed by Dansikirul et al.12 included four patients who were administered sirolimus and tacrolimus in combination.
The inclusion of liver function, expressed as AST > 37 IU/L in the pharmacokinetic model, reached statistical significance only in the study by Goluvobic et al.7, in which the Cl/F of sirolimus was reduced by 37% in patients with compromised liver function. This result is in line with previous studies, which have found reductions of 31.8% and 36.0% in patients with mild and moderate hepatic impairment, respectively23. In fact, a 50% reduction in the maintenance dose of sirolimus is recommended in patients with severe hepatic impairment24.
Sirolimus is widely distributed in blood components, mainly in erythrocytes, but is sparsely distributed in plasma (< 5%). The determining factors for sirolimus to bind to red blood cells are liposolubility, the degree of ionization, molecular size, and capacity for hydrogen bonding5,25. However, in the studies reviewed, no correlation was observed between clearance and hematocrit despite its inclusion as a covariate in most of them. This result is in contrast to that observed in cancer patients treated with sirolimus26, in which an inverse relationship was found between hematocrit and sirolimus clearance.
No study assessed concomitant treatment with corticosteroids as a covariate. Although the induction and inhibition interactions of corticosteroids with the metabolism and transport pathways common to immunosuppressants are known, there is little evidence of the clinical impact of the interactions27,28; for this reason, it would have been interesting to include this covariate.
In conclusion, according to the available literature, the two-compartment model was the pharmacokinetic model of choice in most of the selected studies. The interindividual variability of the pharmacokinetic parameters of sirolimus is explained by variables such as age, weight, liver function, cyclosporine exposure and dose, sirolimus dose, CYP3A5 genetic polymorphisms, serum creatinine, and concomitant treatment. These results provide relevant information to optimize immunosuppressive therapy with sirolimus in renal transplant patients. However, these population pharmacokinetic models need to be validated to assess their suitability and predictive capacity before they are applied in the case of individualized dosage adjustment in specific patient populations.
FundingNo funding.
Conflict of interestsNo conflict of interests.

