
To develop a panel of indicators to monitor antimicrobial stewardship programs activity in the emergency department.
MethodsA multidisciplinary group consisting of experts in the management of infection in emergency departments and the implementation of antimicrobial stewardship programs (ASP) evaluated a proposal of indicators using a modified Delphi methodology. In the first round, each expert classified the relevance of each proposed indicators in two dimensions (healthcare impact and ease of implementation) and two attributes (prioritisation level and frequency). The second round was conducted based on the modified questionnaire according to the suggestions raised and new indicators suggested. Experts modified the prioritisation order and rated the new indicators in the same manner as in the first round.
Results61 potential indicators divided into four groups were proposed: consumption indicators, microbiological indicators, process indicators, and outcome indicators. After analysing the scores and comments from the first round, 31 indicators were classified as high priority, 25 as intermediate priority, and 5 as low priority. Moreover, 18 new indicators were generated. Following the second round, all 61 initially proposed indicators were retained, and 18 new indicators were incorporated: 11 classified as high priority, 3 as intermediate priority, and 4 as low priority.
ConclusionsThe experts agreed on a panel of ASP Indicators adapted to the emergency services prioritised by level of relevance. This is as a helpful tool for the development of these programs and will contribute to monitoring the appropriateness of the use of antimicrobials in these units.
Desarrollar un panel de indicadores para monitorizar la actividad de los programas de optimización del uso de antimicrobianos en los servicios de urgencias.
MétodosUn grupo multidisciplinar formado por expertos en el manejo de la infección en urgencias y en la implantación de programas de optimización de uso de antimicrobianos (PROA) evaluó una propuesta de indicadores utilizando una metodología Delphi modificada. En una primera ronda, cada uno de los expertos clasificó la relevancia de cada indicador propuesto en dos dimensiones (repercusión asistencial y facilidad de implantación) y dos atributos (nivel de priorización y periodicidad de medida). La segunda ronda se realizó a partir del cuestionario modificado de acuerdo con las sugerencias planteadas y nuevos indicadores sugeridos por los participantes. Los expertos efectuaron modificaciones en el orden de priorización y calificaron los nuevos indicadores propuestos de la misma manera que en la primera ronda.
ResultadosSe propusieron un total de 61 potenciales indicadores divididos en cuatro grupos: indicadores de consumo, microbiológicos, de proceso y de resultado. Tras el análisis de las puntuaciones y los comentarios realizados en la primera ronda, 31 indicadores fueron clasificados como de alta prioridad, 25 de prioridad intermedia y 5 de baja prioridad. Además se generaron 19 nuevos indicadores. Tras la segunda ronda, se mantuvieron los 61 indicadores inicialmente propuestos y adicionalmente se incorporaron 18 nuevos: 11 como de alta prioridad, 3 como de intermedia y 4 como de baja prioridad.
ConclusionesLos expertos consensuaron un panel de indicadores PROA adaptado a los servicios de urgencias priorizados por nivel de relevancia como un elemento de ayuda para el desarrollo estos programas, que contribuirá a monitorizar la adecuación del uso de antimicrobianos en estas unidades.
Over recent decades, the progressive increase in antimicrobial resistance has had a strong impact on healthcare systems worldwide.1 Associations have been found between infections caused by multidrug-resistant microorganisms and increased mortality, increased hospital stay, and significant increases in healthcare costs.2,3 Excessive and/or inappropriate use of antimicrobials has been found to contribute to the emergence, rapid spread, and perpetuation of these multidrug-resistant strains.4 Thus, in recent years, antimicrobial stewardship programmes (ASPs) have been developed to optimise their use while minimising the spread and number of infections caused by multidrug-resistant bacteria.5 The implementation of these programmes has been recognised as a priority by health administrations and scientific societies.5,6
To date, most of the reported experiences of these programmes have focused on hospitalised patients, particularly critical patients, and more recently, on outpatient settings.7,8 Emergency departments (EDs) are one of the most relevant services for implementing ASPs. These departments are where the first doses of antibiotics are prescribed to patients who are to be hospitalised and to those returning to primary care; they are also where large numbers of antibiotics are prescribed to patients discharged directly to their homes or other healthcare centres. Several studies have reported significant increases in the number of infections caused by multidrug-resistant bacteria in EDs.9,10 Although guidelines on ASPs recognise that EDs are preferential sites for their implementation, the participation of multidisciplinary teams in EDs is still limited.11 On the other hand, there is a lack of uniformity in the type of indicators used to monitor the use of antimicrobials in this setting,12,13 which hinders the implementation of ASPs. However, the indicators typically associated with ASPs may not be directly applicable to their implementation in EDs as they primarily focus on inpatient management.
The aim of this study was to create a panel of indicators that could be used to monitor the correct utilisation of antimicrobial agents in EDs. An expert panel employed a modified Delphi methodology to achieve consensus during the development process.
MethodsThe study was designed following a modified Delphi methodology. Initially, a coordination committee comprising 4 members from the Spanish Society of Hospital Pharmacy (SEFH) and the Spanish Society of Emergency Medicine (SEMES) utilised their knowledge, experience, and a literature review to propose a set of indicators. These indicators took into account criteria of evidence, intervention outcomes, ease of implementation (resource requirements), and priority level (essential or advanced). Subsequently, an evaluation panel was formed comprising 20 Spanish experts with proven experience in the use of antimicrobials and ASPs. The panel included 5 specialists with experience in EDs, 5 specialists in infectious diseases, 5 pharmacists with more than 3 years' experience in EDs, and 5 other specialists in ASPs from hospital pharmacy, intensive care medicine, and microbiology.
The proposed indicators were evaluated using a RAND/UCLA Appropriateness Method combining the Delphi technique with the Nominal Group Technique. This approach involves 2 evaluation rounds: in the first round each panel member makes an evaluation; in the second round the evaluations are pooled.14 In the first round, the members of the evaluation panel were e-mailed a document containing the list of indicators, a basic description of the indicators, and relevant bibliographical references. The experts could comment on each indicator and propose new indicators.
Each panel member rated the relevance of each of the proposed indicators on 2 dimensions (care outcomes and ease of implementation) and 2 attributes (priority level and recommended measurement frequency for each indicator [quarterly, half-yearly, or annual]). The 2 dimensions were scored on a scale ranging from 0 (complete disagreement) to 10 (complete agreement). The priority level was scored using a scale ranging from 1 (high) to 3 (low).
The coordinating committee evaluated the panel members' scores and comments and prepared a second questionnaire which retained, modified, or eliminated the indicators. Regarding care outcome and ease of implementation, each indicator was classified as appropriate (median score >6), inappropriate (median score <4), or inconclusive (median score 4–6). The criterion for excluding an indicator from moving to the second round was that it was classified as inappropriate according to its median score on care outcome or ease of implementation. Regarding the priority level, each indicator was classified as high (median = 1), medium (median = 1.5–2), or low (median = 2.5–3) priority.
In the second round, the experts were sent the modified questionnaire, which included the median scores and ranges from the first round, the anonymous comments, and an analysis of the results for each indicator to aid them in the next evaluation round. The experts reassessed the indicators and their priority level. The purpose of this round was to give the experts the opportunity to review their own assessments in the light of the other experts' assessments. They were also asked to assess the new indicators that had been proposed in the first round. These new indicators were scored in the same way as in the first round.
ResultsFig. 1 shows the study flow chart with the overall results obtained in each round. The coordinating group put forward an initial list of 61 potential indicators to the evaluation panel. These indicators were divided into 4 blocks: consumption indicators, microbiological indicators, process indicators, and outcome indicators.

After analysing the scores and comments, 31 indicators were classified as high priority, 25 as medium priority, and 5 as low priority. None of the initially proposed indicators were excluded from the second round, because they all scored more than 6 points on care outcome and ease of implementation. In addition, 19 new potential indicators were proposed to monitor these activities. The evaluators' anonymised opinions were included in the document mailed out in the second round.
After the second round, 18 of the 19 new indicators were accepted. Of the 79 final indicators, 42 (53.2%) were scored as high priority, 28 (35.4%) as medium priority, and 9 (11.4%) as low priority. The indicators were grouped into 4 blocks: 50 (63.3%) antimicrobial use indicators, 7 (8.9%) microbiological indicators, 13 (16.5%) process indicators, and 9 (11.4%) outcome indicators. To ensure a uniform measurement frequency, we calculated the median frequency according to the first and second rounds for each group of indicators and then assigned this frequency to all the indicators in the corresponding group. Tables 1–3 show the final indicators and their measurement frequencies.
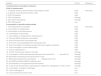
Result of the prioritisation of antimicrobial consumption indicators.
| Indicator | Priority | Frequency |
|---|---|---|
| I. Antimicrobial consumption indicators | ||
| Units of measurement | ||
| 1- % patients receiving antimicrobials at discharge from EDs | High | Half-yearly |
| 2- % patients receiving antimicrobials in EDs | High | |
| 3- DDD/100 patients | High | |
| 4- PDD/100 patients | Average | |
| 5- DDT (DOT)/100 patients | Average | |
| 6- DID/1000 patients | Low | |
| Consumption of specific antimicrobials | ||
| 7- Total antibacterial consumption | High | Half-yearly |
| 8- Consumption of carbapenems | High | |
| 9- Consumption of fluoroquinolones | High | |
| 10- Consumption of macrolides | High | |
| 11- Consumption of 3rd-generation cephalosporins | High | |
| 12- Total anti-MRSA antibiotics consumption | High | |
| 13- Amoxicillin/amoxicillin-clavulanate ratio | High | |
| 14- Amoxicillin-clavulanate/piperacillin-tazobactam ratio | High | |
| 15- Total consumption of multidrug-resistant anti-Gram-negative antibiotics | High | |
| 16- Total consumption of new antimicrobials | High | |
| 17- Cost of antibacterials, € | High | |
| 18- % DDD of each group relative to the total | Average | |
| 19- Consumption of beta-lactamase-sensitive penicillins (penicillin V+penicillin G) | Average | |
| 20- Macrolides IV/respiratory fluoroquinolones IV ratio | Average | |
| 21- Metronidazole/piperacillin-tazobactam+carbapenemics ratio | Average | |
| 22- Anti-MRSA antibiotics/MSSA antibiotics ratio | Average | |
| 23- Diversification of anti-pseudomonal beta-lactams | Average | |
| 24- % use of new 5th-generation cephalosporins (ceftaroline, ceftobiprole) in CAP or SSTI | Average | |
| 25- Consumption of systemic antifungals | Low | |
| 26- Cost in antifungals, € | Low | |
| 27- Fluconazole/echinocandins ratio | Low | |
DDD, defined daily dose; PDD, prescribed daily dose; DDT, days of treatment; DOT, days of therapy; DID, dose per inhabitant per day; ED, emergency department; SSTI, skin and soft tissue infection; CAP, community-associated pneumonia; MRSA, methicillin-resistant S aureus; MSSA, methicillin-sensitive S aureus.
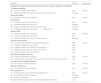
Result of the prioritisation of indicators for specific infectious processes.
| Indicator | Priority | Frequency |
|---|---|---|
| Indicators of appropriate prescribing for the most common infectious conditions | ||
| Tonsillopharyngitis | ||
| 28- % patients treated with antibiotic | High | Annual |
| 29- % patients treated with beta-lactamase-sensitive penicillins | Average | |
| Acute bronchitis | ||
| 30- % patients treated with antibiotics | High | Annual |
| Pneumonia | ||
| 31- % patients treated with quinolones | High | Annual |
| 32- % patients treated with amoxicillin | Average | |
| 33- % patients treated with amoxicillin-clavulanate | Average | |
| 34- % patients treated with beta-lactam+azithromycin | Average | |
| Acute COPD | ||
| 35- % patients treated with antibiotics | High | Annual |
| 36- % patients treated with quinolones | High | |
| 37- % patients treated with amoxicillin-clavulanate | Average | |
| Urinary tract infection | ||
| 38- % asymptomatic bacteriuria treated with antibiotics | High | Annual |
| 39- % patients treated with quinolones | High | |
| 40- % patients treated with fosfomycin/tromethamol | High | |
| 41- % patients treated with amoxicillin-clavulanate | High | |
| 42- % patients treated with nitrofurantoin | Low | |
| Skin and soft tissue infection | ||
| 43- % patients with MRSA coverage | High | Annual |
| 44- % patients receiving dalbavancin for SSTI and referral for follow-up in HHUs | Low | |
| Central nervous system infection | ||
| 45- Time to start of antibiotic therapy | High | Annual |
| Febrile neutropenia | ||
| 46- Time to start of antibiotic therapy | High | Annual |
| Other indicators | ||
| 47- % prescriptions according to protocol/guidelines | High | Annual |
| 48- Time to start of antibiotic therapy | Average | |
| 49- Duration of treatment | Average | |
| 50- Sequential therapy (oral antimicrobials/IV antimicrobials ratio) | Low | |
SSTI, skin and soft tissue infection; HHU, home hospitalisation unit; COPD, chronic obstructive pulmonary disease; MRSA, methicillin-resistant S aureus; SSTI, skin and soft tissue infection.
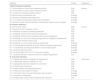
Results of the prioritisation of microbiological, process, and outcome indicators.
| Indicator | Priority | Frequency |
|---|---|---|
| II. Microbiological indicators | ||
| 51- Annual report on urine culture resistance profile | High | Annual |
| 52- Annual report on blood culture resistance profile | High | |
| 53- Incidence of multidrug-resistant cultures | High | |
| 54- Blood culture contamination rate | Average | |
| 55- Number of Streptotest tests performed | Average | |
| 56- % of cultures correctly taken before start of treatment | Average | |
| 57- Number of blood cultures extracted in patients with central venous catheters | Average | |
| III. Process indicators | ||
| 58- ASP activity in EDs | High | Annual |
| 59- Presence of ASP managers in EDs | High | |
| 60- Availability of empirical treatment guidelines | High | |
| 61- Availability of blood culture follow-up programme | High | |
| 62- Availability of blood culture sampling improvement programme | High | |
| 63- Availability of a continuous training programme for emergency professionals | High | |
| 64- Annual ASP sessions held in EDs | High | |
| 65- Availability of a urine culture follow-up programme | Average | |
| 66- % of bacteraemias followed-up by the infectious diseases department | Average | |
| 67- % of treatments correctly documented in clinical history/report | Average | |
| 68- % patients referred to HHD | Average | |
| 69- Use of biomarkers (PCR, PCT) in decision-making | Average | |
| 70- % patients referred to infectious diseases outpatient department | Low | |
| IV. Outcome indicators | ||
| 71- % appropriate empirical treatment in bacteraemia | High | Half-yearly |
| 72- % appropriate empirical treatment in UTIs | High | |
| 73- % appropriate empirical treatment in pneumonia | High | |
| 74- % mortality due to infection | High | |
| 75- % septic patients with appropriate doses | High | |
| 76- % follow-up visits related to infection | Average | |
| 77- % ICU/semi-critical care unit admissions due to infection | Average | |
| 78- % treatment not indicated | Average | |
| 79- Average length of stay in EDs of patients with infections | Low | |
SSTI, skin and soft tissue infection; UTI, urinary tract infection; ICU, intensive care unit; HDU, home hospitalisation unit; ASP, antimicrobial stewardship program; ICU, intensive care unit; PCR, polymerase chain reaction; PCT, procalcitonin; ED, emergency department.
Antimicrobial stewardship programs have proven to be essential tools for improving the use of antimicrobials in hospital settings and are now perceived as a growing need within healthcare teams.6,15 Thus, there is a need to describe the indicators that aid in monitoring the use of antimicrobials in specific departments. The current investigation shows, for the first time, the indicators deemed significant by experts from various specialities for monitoring the performance of ASPs in EDs. It provides a potential starting point from which to prioritise activities for optimising antimicrobial usage in such departments. The approach yielded 79 indicators divided into 4 blocks (consumption, microbiological, process, and outcome indicators) and 3 priority levels, half of which were considered high priority.
Previous authors have discussed the lack of ASP indicators in EDs.13 A recent study on the use of antimicrobials in these departments suggested that although the described experiences were encouraging, there remains a need for well-planned studies using relevant indicators.12 The present study followed a methodology similar to that used by Schoffelen et al.16 They selected 22 indicators associated with ASP activities in EDs that comprised process indicators covering ASP prerequisites, empirical therapy, documentation of information, and post-discharge educational activities, but without including indicators relating to antimicrobial use, resistance monitoring, or clinical outcomes. To date, we have not found any publication that has established a set of consumption and microbiological indicators that can be used to infer the quality of antimicrobial use in EDs.
The indicators obtained from this consensus were grouped into 4 blocks, addressing the need to monitor different aspects of ASP activities. Although these programmes have been shown to optimise antimicrobial use while reducing direct costs and hospital stays,17,18 their effect on the emergence and spread of multidrug-resistant strains remains uncertain.19 The implementation of ASPs in EDs has been shown to reduce overall antimicrobial prescribing by 10%–40%, while increasing adherence to clinical practice guideline recommendations.20 However, there remains a pressing need for microbiological indicators related to resistance profiles and adequate culture collection,21,22 as they would allow treatment protocols to be updated to the resistance profiles and ensure the adequate identification of the possible pathogens responsible for infections. The indicator panel included 14 process indicators (Table 3), including key elements, such as designating the individuals responsible for applying ASP policies in EDs, and other elements essential to coordinating ASP activity and achieving the objectives of optimising consumption and improving clinical outcomes.
The methodology used in this study has certain limitations. Firstly, the final results do not reflect the indicators supported by clinical evidence. However, to date, there have been no comparative studies on the impact of these indicators on the clinical outcomes of patients or the emergence of antimicrobial-resistant strains.12 Furthermore, although the cut-off points used to select the priority levels were based on previous experience,21 they are not based on rigorously established criteria. It should be noted that the experts were selected according to their experience in the field of study as well as their involvement in ASPs. However, the expert panel was not analysed to ensure sufficient representativeness (in terms of gender, age, years of experience, etc), as suggested by the Delphi methodology,23 thereby resulting in potential bias in the obtained evaluations.
During the 2 evaluation rounds, several members of the expert panel noted that it can be difficult to extract antimicrobial use data from data systems. This barrier is widely documented in the literature24 and can hinder the development of ASPs. Despite this aspect, all the evaluated indicators for ease of implementation had a median score of more than 6 points. This study is also limited by the lack of evaluators specialised in information systems, and therefore it remains unclear how much time and resources are required to access these data with accuracy.
The final document of this study includes the appropriate indicators for monitoring antimicrobial use, resistance profiles, and the secondary clinical outcomes related to infectious processes in EDs within the scope of ASPs. Given the scarce information available on indicators for monitoring ASPs in EDs, as well as the multidisciplinary nature and experience of the expert panel, we suggest that the indicator panel obtained represents a turning point for the implementation of these programmes in EDs. The monitoring of these indicators will prove valuable in promoting the implementation of ASPs in EDs, and in comparing the use of antimicrobials and their association with resistance profiles.
FundingThis project was conducted with funds from the SEFH Call for Project Grants for Working Groups 2022–2023.
Author declarationJesús Ruiz, M. Rosario Santolaya, Javier Candel, and Juan González participated in developing and designing the study, data collection, data analysis and interpretation, writing the article, and approving the final version for publication.
The other authors participated in the evaluation of the proposed indicators, including their prioritisation, as well as approval of the final document.
Members of the ASP-Emergency group:
- •
Jesús Ruiz Ramos. Servicio de Farmacia, Hospital Santa Creu y San Pau.
- •
María Rosario Santolaya Perrín. Servicio de Farmacia, Hospital Príncipe de Asturias.
- •
Juan González del Castillo. Servicio de Urgencias, Hospital Clínico Universitario San Carlos.
- •
Francisco Javier Candel. Unidad de Enfermedades Infecciosas, Hospital Clínico Universitario San Carlos.
- •
Alejandro Martín Quirós. Servicio de Urgencias, Hospital Universitario La Paz.
- •
Joaquín López-Contreras González. Unidad de Enfermedades Infecciosas, Hospital Santa Creu y San Pau.
- •
Agustín Julián Jiménez. Servicio de Urgencias, Complejo Hospitalario Universitario de Toledo.
- •
Ana Suárez-Lledó Grande. Servicio de Farmacia, Hospital Universitari de Bellvitge.
- •
Julio Javier Gamazo Del Rio. Servicio de Urgencias, Galdakao-Usansolo.
- •
Ana Gallur Martínez. Servicio de Urgencias, Hospital Príncipe de Asturias.
- •
Manuel Linares Rufo. Servicio de Microbiología, Hospital Príncipe de Asturias.
- •
Juan Pasquau Liaño. Unidad de Enfermedades Infecciosas, Hospital Universitario Virgen de las Nieves.
- •
Miguel Salavert Lletí. Unidad de Enfermedades Infecciosas, Hospital Universitari i Politècnic La Fe.
- •
Beatriz Calderón Hernanz. Servicio de Farmacia, Hospital Universitari Son Llàtzer.
- •
Álvaro Eloy Monje López. Servicio de Farmacia. Hospital Santa Creu i Sant Pau.
- •
Paula Ramírez Galleymore. Unidad de Medicina Intensiva, Hospital Universitari i Politècnic La Fe.
- •
Leonor Periañez Parraga. Servicio de Farmacia, Hospital Universitari Son Espases.
- •
Francisco Moreno Ramos. Servicio de Farmacia, Hospital Universitario La Paz.
- •
Cristina Calzón Blanco. Servicio de Farmacia, Hospital Universitario Central de Asturias.
- •
Daniel Echeverría Esnal. Servicio de Farmacia, Hospital del Mar.

