


There is limited scientific evidence on the cetuximab exposure-response relationship and no concentration threshold has been associated with optimal disease control. The aims were to assess, in a real-life setting, the relationship between steady state cetuximab concentrations (Ctrough, ss) and disease control.
MethodA prospective observational study in patients with metastatic colorectal cancer or head and neck cancer treated with cetuximab. Steady state trough concentrations were compared with the results of radiological assessment of response (progression or clinical benefit). Generalized estimating equations analysis was performed. To test the association between steady state concentrations and overall survival and progression-free survival, Cox proportional hazard models were developed. An optimal cut-off point was searched using the area under the receiver operating characteristic curve.
ResultsA total of 30 steady state cetuximab concentrations from 16 patients were analysed. Median Ctrough, ss was 26.86 mg/L and there was marked inter- and intraindividual variability (standard deviation 32.4 mg/L and 16.9 mg/L, respectively). A positive association was found between cetuximab Ctrough, ss and clinical benefit (odds ratio 1.24, 95% confidence interval: 0.95-1.63, p = 0.113), although without reaching statistical significance. The area under the receiver operating characteristic curve (n = 30) had moderate discrimination power (0.71; 95% confidence interval 0.49-0.93), and the empirical optimal cutoff point was 19.12 mg/L. However, no association was observed between cetuximab Ctrough, SS and survival in metastatic colorectal cancer or neck cancer patients.
ConclusionsWe cannot confirm a relationship between cetuximab Ctrough, SS and disease control despite a positive association. This study was conducted with a small sample, which reduces the power analysis. Further controlled randomised studies with a sufficient number of patients are needed.
Evaluar, en condiciones de vida real, la relación entre las concentraciones valle en estado estacionario de cetuximab y el control de la enfermedad, así como buscar la relación entre estas concentraciones y la supervivencia. Además, estudiar si existe una concentración límite que se pueda asociar con la probabilidad de beneficio clínico.
MétodoEstudio observacional prospectivo llevado a cabo en pacientes con cáncer colorrectal metastásico o cáncer de cabeza y cuello en tratamiento con cetuximab. Se realizó un análisis de regresión de ecuaciones de estimación generalizadas para evaluar la asociación entre la concentración valle en estado estacionario de cetuximab y la respuesta al tratamiento (progresión o beneficio clínico). Mediante modelos de riesgos proporcionales de Cox, se evaluó la asociación entre la mediana de concentraciones valle en estado estacionario de cetuximab en cada paciente o la última medida con la supervivencia global y la supervivencia libre de progresión, en cada una de las patologías. Asimismo, se buscó un punto de corte óptimo a través del área bajo la curva de características operativas del receptor.
ResultadosSe analizaron 30 muestras de 16 pacientes. La concentración valle en estado estacionario mediana fue 26,86 mg/l y se encontró una gran variabilidad inter e intraindividual (desviación estándar de 32,4 y 16,9 mg/l, respectivamente). Se observó una asociación positiva entre la concentración valle en estado estacionario y el beneficio clínico (odds ratio 1,24; intervalo de confianza del 95%: 0,95-1,63; p = 0,113), aunque no alcanzó significación estadística debido a la baja potencia. El área bajo la curva de características operativas del receptor de las concentraciones (n = 30) tuvo una moderada capacidad discriminatoria (área bajo la curva de características operativas del receptor 0,710; intervalo de confianza del 95%: 0,49-0,93) y el punto de corte estimado fue de 19,12 mg/l. Sin embargo, no se observó relación entre la supervivencia y las concentraciones valle en estado estacionario en ninguna de las patologías.
ConclusionesNo se ha podido confirmar una relación entre exposición a cetuximab y eficacia, a pesar de encontrar una tendencia positiva en el control de la enfermedad con el aumento de la concentración valle en estado estacionario. El nivel de evidencia se vio reducido por la pequeña muestra de pacientes en cada grupo, por lo que se necesitan estudios aleatorizados y controlados, con un número suficiente de pacientes, para evaluar adecuadamente esta relación.
Colorectal cancer (CRC) is the most common tumour in Spain (16%)1. It has a high mortality rate because 25% of patients have metastatic disease at the time of diagnosis and another 50% eventually develop metastases2. Head and neck cancer (HNC) accounts for 4% of all tumours.
Cetuximab is a chimeric IgG1 monoclonal antibody (mAb) specifically targeting the extracellular domain of the epidermal growth factor receptor (EGFR)3. It has nonlinear pharmacokinetics4–6 and is indicated for the treatment of patients with EGFR-expressing metastatic CRC (mCRC) with native RAS genes, and in patients with locally advanced, recurrent, and/or metastatic HNC3.
Dosing by body surface area or weight is a subject of debate regarding oncology drugs7, and mAb in particular8–10. Nevertheless, this strategy is widespread in clinical development, and is based on the theory that it reduces interindividual variability in drug distribution and elimination. However, mAb dosing based on body size tends to overdose larger patients and underdose smaller patients10.
On the other hand, mAbs fulfill the characteristics needed to perform pharmacokinetic monitoring and are designed to continuously neutralize their target antigens, which is achieved using minimal concentrations (Ctrough)11. This aspect, coupled with their long elimination half-life, means that steady-state trough concentrations (Ctrough, SS) have the potential to adequately represent systemic exposure12. Thus, most mAb studies measuring exposure-response relationships have shown that Ctrough is more relevant to predicting efficacy than either peak concentration (Cmax) or area under the curve13.
The main population pharmacokinetic studies conducted on oncology patients treated with cetuximab4,14–17 have described its kinetic parameters, interindividual variability, and covariates. However, few publications have studied the relationship between cetuximab exposure and clinical response. Studies on patients with native KRAS mCRC have found a relationship between survival and clearance or Ctrough at day 1414,18,19. Previous studies have also observed a relationship between overall clearance and survival15 or between Ctrough and clinical benefit16,20 in patients with HNC.
As already performed with other mAbs21–26, the pharmacokinetic monitoring of cetuximab could serve as a tool to predict efficacy and, in the case of insufficient exposure, to adapt the patient's dosage. However, there is still little scientific evidence to support the therapeutic drug monitoring of mAbs used in oncological pathologies9,12,27.
The main objective of this study was to assess the relationship between the Ctrough, SS of cetuximab and the clinical benefit rate. The secondary objectives were to investigate the relationship between Ctrough, SS and survival and to study whether there is a threshold Ctrough, SS that can be associated with the likelihood of clinical benefit.
MethodsProspective observational study conducted in a tertiary hospital. Inclusion criteria were as follows: adult patients on cetuximab treatment diagnosed with mCRC or HNC, with measurable disease allowing assessment using RECIST criteria, and life expectancy more than 12 weeks. Exclusion criteria were as follows: poor venous access, any situation that prevented the patient from understanding their participation in the study, and patients who did not sign the informed consent form or were unable to sign it.
The samples were collected prospectively and then individual variables were collected retrospectively. The end of follow-up was January 31, 2020.
Cetuximab was administered according to standard clinical practice. Samples from each patient were obtained in Ctrough, SS at the time of each assessment of treatment response, from inclusion in the study until the end of treatment, death, or study closure. The first scheduled extraction from any patient was after at least 12 weeks of mAb treatment because treatment response is not usually assessed at shorter intervals.
Blood samples were kept in 3-mL EDTA tubes, allowed to stand for 2 hours, and then centrifuged at 1,000 x g for 10 minutes. The plasma obtained was then stored at –20 °C.
Free cetuximab concentrations were determined using a validated Enzyme-Linked Immunosorbent Assay (ELISA) technique: the SHIKARI Q-CET kit (Matriks Biotek Laboratories). We used the TRITURUS automated analyser (Grifols) and followed the manufacturer's specifications. Concentrations were expressed as mg/L. Each sample was analysed in duplicate and the mean was obtained as the result when the difference between the two values was less than 5%. For larger differences, the result was discarded and the analysis was repeated.
We recorded 55 individual variables (demographic, clinical, biochemical, treatment and response) in an Excel Data Collection Logbook. The information was compiled from the data recorded in the electronic assisted prescription software (Farhos, Visual Limes) and the hospital's clinical and administrative information system (Selene Hospitales, Cerner).
RECIST version 1.1 criteria were used to assess response every 12 weeks or when clinically indicated. The patients’ tumour responses were classified into two categories: clinical benefit (stable disease [SD], partial response [PR], or complete response [CR]), or progression (PE).
Progression-free survival (PFS) was defined as the time elapsed between the first mAb administration and disease progression or all-cause mortality. Overall survival (OS) was defined as the time between the first mAb administration and all-cause mortality. Patients who did not experience either event were censored at the date of last contact.
To assess the association between cetuximab Ctrough, SS and clinical benefit, we conducted a generalized estimating equations (GEE) regression analysis28. This analysis takes into account correlations between different Ctrough, SS measurements over time for the same patient. The dependent variable was clinical benefit (yes/no) at each tumour assessment time point. The link function was logit and the covariance structure was exchangeable. The Ctrough, SS of cetuximab at each time point was entered as the independent variable. The odds ratio (OR) showed the association between each additional Ctrough,SS of 10 mg/L cetuximab and clinical benefit. The corresponding 95% confidence intervals (95%CI) were also obtained.
Median follow-up was estimated using the inverse Kaplan-Meier method29. OS and PFS were assessed. Four univariate Cox proportional hazards models were constructed to assess the association between the median Ctrough, SS of cetuximab (mg/L) or the last Ctrough, SS measurement and each of the outcomes (OS and PFS in each pathology). Survival curves were estimated using the Kaplan-Meier method. Proportional hazard assumptions were assessed using Schoenfeld residuals.
An optimal cutoff point was estimated based on the Area Under the Curve of the Receiver Operator Characteristic (AUC-ROC).
A P-value of 0.05 was used as a cutoff for statistical significance. Analyses were conducted using Stata/IC v.16. software (StataCorp. 2019. Stata Statistical Software: Release 16. College Station, US).
The study was approved by the hospital Ethics Committee. Patients were recruited between February 2018 and January 2020. All patients gave signed informed consent.
ResultsA total of 16 patients on cetuximab treatment were included in the study. Two patients in the HNC group had a histological diagnosis of oesophageal cancer and were maintained in the response assessment, but were excluded from the survival analyses because of the possibility of having a different prognosis.
Of the patients assessed, 7 (43.8%) were diagnosed with mCRC and 9 (56.3%) with HNC. All patients treated with cetuximab for mCRC had wild type RAS status, according to the hospital's protocol.
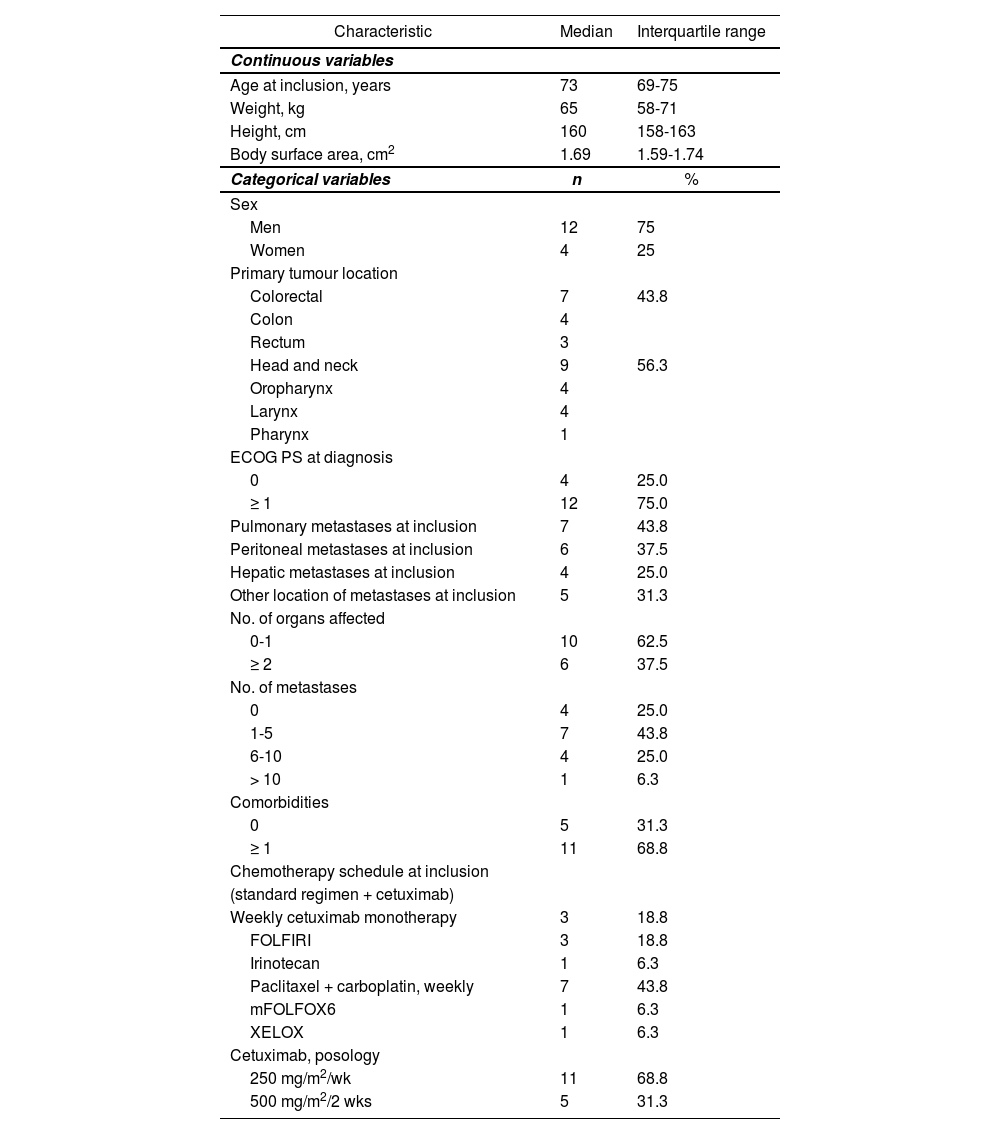
Table 1 shows the baseline characteristics of the cetuximab patient population. In total, 9 of the patients (56.3%) on cetuximab treatment had epidermoid histology and 7 (43.8%) had adenocarcinoma. At study inclusion, all patients (100%) were in stage IV, although 4 (25%) had no metastases (HNC patients), and 7 patients (43.8%) were receiving first-line treatment for metastatic disease (median; 1 prior line; maximum, 3).
Baseline characteristics of the patient population on cetuximab
| Characteristic | Median | Interquartile range |
|---|---|---|
| Continuous variables | ||
| Age at inclusion, years | 73 | 69-75 |
| Weight, kg | 65 | 58-71 |
| Height, cm | 160 | 158-163 |
| Body surface area, cm2 | 1.69 | 1.59-1.74 |
| Categorical variables | n | % |
| Sex | ||
| Men | 12 | 75 |
| Women | 4 | 25 |
| Primary tumour location | ||
| Colorectal | 7 | 43.8 |
| Colon | 4 | |
| Rectum | 3 | |
| Head and neck | 9 | 56.3 |
| Oropharynx | 4 | |
| Larynx | 4 | |
| Pharynx | 1 | |
| ECOG PS at diagnosis | ||
| 0 | 4 | 25.0 |
| ≥ 1 | 12 | 75.0 |
| Pulmonary metastases at inclusion | 7 | 43.8 |
| Peritoneal metastases at inclusion | 6 | 37.5 |
| Hepatic metastases at inclusion | 4 | 25.0 |
| Other location of metastases at inclusion | 5 | 31.3 |
| No. of organs affected | ||
| 0-1 | 10 | 62.5 |
| ≥ 2 | 6 | 37.5 |
| No. of metastases | ||
| 0 | 4 | 25.0 |
| 1-5 | 7 | 43.8 |
| 6-10 | 4 | 25.0 |
| > 10 | 1 | 6.3 |
| Comorbidities | ||
| 0 | 5 | 31.3 |
| ≥ 1 | 11 | 68.8 |
| Chemotherapy schedule at inclusion | ||
| (standard regimen + cetuximab) | ||
| Weekly cetuximab monotherapy | 3 | 18.8 |
| FOLFIRI | 3 | 18.8 |
| Irinotecan | 1 | 6.3 |
| Paclitaxel + carboplatin, weekly | 7 | 43.8 |
| mFOLFOX6 | 1 | 6.3 |
| XELOX | 1 | 6.3 |
| Cetuximab, posology | ||
| 250 mg/m2/wk | 11 | 68.8 |
| 500 mg/m2/2 wks | 5 | 31.3 |
ECOG PS: Eastern Cooperative Oncology Group Scale of Performance Status; FOLFIRI: (Folínico/Fluorouracilo/Irinotecán); mFOLFOX6: (Folínico/Fluorouracilo oxaliplatino); XELOX: (Oxaliplatini/capecitabina).
A total of 30 samples were analysed (minimum: 1 concentration per patient; maximum, 4; median 1.9). We observed marked inter- and intraindividual variability (standard deviation: 32.4 and 16.9 mg/L, respectively). The median Ctrough, SS was 26.86 mg/L (P25-P75 = 16.29-69.72): Table 2 shows its breakdown by clinical benefit.
To address the main objective, the 30 samples from 16 mCRC and HNC patients were analysed together: 14 samples from 7 mCRC patients and 16 samples from 9 HNC patients. Clinical benefit was observed in 12/14 (86%) measurements in 6 mCRC patients and in 10/16 (63%) measurements in 7 HNC patients. The GEE model suggested a positive association between Ctrough, SS and clinical benefit (OR 1.24: 95%CI: 0.95-1.63; P = 0.113), although it did not reach statistical significance due to low power. To achieve 80% power, 56 patients would be needed. Figure 1 shows the probability of clinical benefit predicted by the model at Ctrough, SS intervals of 20 mg/L cetuximab.
.")
The median follow-up of the 7 mCRC patients on cetuximab treatment was 27 months (95%CI: 11.13-not estimable) and the median OS was not reached. Cox regression showed no association between median Ctrough, SS (HR 0.99; 95%CI: 0.95-1.05; P = 0.938) or last Ctrough, SS (HR 1.04; 95%CI: 0.98-1.11; P = 0.212) and OS. Median PFS was 16 months (95%CI: 4.03- not estimable). In this case, there was also no association between the median Ctrough, SS (HR 0.96; 95%CI: 0.92-1.01; P = 0.152) and PFS, nor with the final Ctrough, SS (HR 1.02; 95%CI: 0.97-1.07; P = 0.442).
In the case of the 7 HNC patients on cetuximab treatment, the median follow-up was 19 months (95%CI: 17-not estimable) and the median OS was also not reached. Cox regression showed no association between median Ctrough, SS (HR 0.99; 95%CI: 0.91-1.07; P = 0.746) or the final Ctrough, SS (HR 1.04; 95%CI: 0.94-1.16; P = 0.416) and the OS. Median PFS was 12 months (95%CI: 4.4-not estimable) and there was also no association between median Ctrough, SS (HR 1.02; 95%CI: 0.95-1.08; P = 0.616) and PFS, nor with final Ctrough, SS (HR 1.12; 95%CI: 0.99-1.27; P = 0.063).
The ROC curve analysis (n = 30) had acceptable discrimination power (AUC-ROC 0.710; 95%CI: 0.49-0.93). The estimated cutoff point, with the highest sensitivity (73%) and specificity (63%), was 19.12 mg/L (Figure 2).
Discussion
Our study foiled lo prove on association between celuximob Ctrough, ss and clinicol benefit in potients with mCRC or HNC. The GEE model found on association between each additional 10 mg/L of cetuximab and a 24% probability of response, although without reaching statistical significance due to low statistical power. To achieve 80% power, 56 patients would be required. Neither was on association found between the median Chough, ss and OS or PFS, or with the final Ctrough, ss in both pathologies. Moreover, in the HNC patient group, the association between cetuximab Ctrough, ss and clinicol benefit was inverted, because since there was a trend toward a higher risk of progression with higher final concentrations, which bordered on statistical significance (P = 0.063).
To our knowledge, only Becher et a/.20 hove previously assessed the association between cetuximab Ctrough, ss and disease control. They studied the association between Ctrough, ss and treatment efficacy 3 months after cetuximab initiation in 25 potients with native KRAS and NRAS HNC under clinicol practice conditions. They found statistically significant differences between the Ctrough, ss of patients with clinicol benefit and the Ctrough, ss of non-responding potients (49.0 ± 16.3 mg/L vs 25.8 ± 17 mg/L; P< 0.01, Mest), according to RECIST 1.0 criteria. On the other hand, Pointreou et a/.15 conducted a retrospective study in 34 potients with HNC treated with monotherapy or with chemotherapy and/or radiotherapy, finding a statistically significant association between global clearance and overall survival. Both PFS (14.1 months vs 11.6 months; P = 0.037) and OS (16.56 months vs 6.34 months; P = 0.007) were higher in potients with cetuximab global clearance values lower than a median of 0.747 L/d. These results suggest that greater exposure to cetuximab may increase survival times (this premise was not tested in their study). In o PK/PD study, Le Louedec et a/.16 obtained data from 16 potients with Ctrough and tumour response. This study was port of a prospective, nonrondomized, multicentre, open-label, clinicol trial in potients with metastatic or recurrent HNC who were treated with platinum, fluorourocil, and cetuximab os first-line therapy. Potients were classified into two groups according to their tumour response os measured using RECIST 1.1 criteria: response to treatment and progression. Potients with response hod a higher Ctrough than potients with progression, both at day 7 (42.6 vs 18.8 mg/L; P = 0.03) and at day 21 (47.4 vs 19.0 mg/L; P = 0.04). They also found an association between Ctrough and performance status (PS) and between PFS and PS. By stratifying patients according to their Ctrough on day 7 with the median as the cutoff value (29 mg/L), median PFS was 194 days in patients with a higher Ctrough vs 106 days in patients with a lower Ctrough (P = 0.0503; n = 23). In this study, because low cetuximab concentrations were associated with worse PS, the authors could not conclude that low exposure, rather than patients’ PS, was responsible for shorter PFS. In a study on patients with native KRAS mCRC, Azzopardi et al.14 found an association between cetuximab global clearance and Ctrough at day 14 and PFS (P = 0.013 and P = 0.03, respectively); Jiang et al.18 suggested that standard doses of cetuximab are not optimal for all patients, because patients with lower clearance have better PFS and OS; and the EVEREST study19 found that native KRAS patients who received maintenance weekly doses of more than 250 mg/m2 had higher concentrations, higher overall response rates, and higher PFS, although the differences did not reach statistical significance.
Regarding target Ctrough, SS, Robert et al.6 suggested that the biologically optimal dose of cetuximab is the lowest dose needed to maintain continuous zero-order clearance. This saturation has been shown to be achieved with maintenance doses of 250 mg/m2 5. However, in simulations of plasma concentrations in patients with different body surface areas, larger patients reached higher steady-state concentrations and therefore the risk of underexposure in smaller patients could not be excluded30. On the other hand, Becher et al.20 noted that Ctrough was more relevant than Cmax in relation to efficacy, which would again point to the need for constant inhibition of the EGFR targets with sustained cetuximab levels until the next administration. Given this background, it would seem to be essential to have a predictive biomarker of efficacy. In our study, we looked for a threshold Ctrough, SS associated with clinical benefit as a biomarker, but the 95%CI of the AUC-ROC included values of less than 0.5, which may have been to the small sample size, among other factors. We did not study the degree of EGFR expression, which could vary over time and influence clearance. Becher et al.20 found an association between a Ctrough, SS of 33.8 mg/L and clinical benefit (ROC curve: 78% specificity and 87% sensitivity; Fisher's exact test: OR 18.6; 95%CI: 1.9-327.8; P = 0.003), measured by liquid chromatography-tandem mass spectrometry.
In our study, the failure to find a statistically significant association between exposure and response may be due to the limitations of patient recruitment, being conducted in a single-centre, and the small sample size. As with any study conducted during clinical practice, failure may also be due to high inter- and intra-individual variability in concentrations, the inclusion of 2 patients with oesophageal cancer, low correlation between response rate and survival, or differences in dosing regimens, chemotherapy schedules, and treatment lines. Furthermore, although it may seem reasonable to identify target concentrations of oncological mAb by comparing exposure and disease control, this approach may not the best option11. All these aspects may have contributed to a failure to adequately assess the effect.
In conclusion, despite the low statistical power of the analysis and, therefore, the lack of statistical significance, we found that a cutoff point for cetuximab of more than 19 mg/L could be associated with good response to treatment. This result could help in the design of future studies with a larger sample size.
Progress in monitoring the mAbs used in oncology should come from prospective multicentre trials that can establish the exposure-response relationship, determine an objective value of efficacy per indication, and demonstrate benefit after increasing the dose in patients with low concentrations. This approach would make it possible to optimize treatment efficiency.
FundingThis work was supported by the Fundación Universidad Alfonso X el Sabio and the Santander Group through the VIII Convocatoria Proyectos de Investigación (project number: 1.010.708).
AcknowledgmentsWe would like to thank all the staff of the Hospital Universitario Severo Ochoa who, in their various ways, contributed to the completion of this project.
Conflict of interestNo conflicts of interests.
Presentation at congressesThe work has been previously presented at the 66th SEFH Congress in the category of I+i Projects.
Contribution to the scientific literature
Since 2004, cetuximab has been used in clinical practice to treat various neoplasms, but there is a lack of a biomarker to predict its efficacy and of relevant information on its exposure-response relationship. This study adds to the evidence on the relationship between cetuximab concentrations and its clinical efficacy, and addresses the issue of a target concentration.
Early Access date (11/29/2021).

