
Dual PEGylated interferon-α (PEG-IFN) and ribavirin therapy has been the main hepatitis C virus (HCV) treatment of the last decade. Current direct-acting antiviral agents have improved the outcome of therapy but also have increased the cost and management complexity of treatment. The current study analyzes host genetics, viral and clinical predictors of sustained viral response (SVR) to dual PEG-IFN and ribavirin therapy in a representative Spanish population.
MethodsObservational prospective multicentre pharmacogenetic cohort study conducted in 12 different hospitals of 12 different Spanish regions. A total of 98 patients with SVR and 106 with non-SVR in response to PEG-IFN and ribavirin therapy were included. 33 single nucleotide polymorphisms located in 24 different genes related with inflammatory, immune and virus response were selected. Clinical and viral data were also analyzed as candidate of SVR predictors.
ResultsIL-28B (rs12979860, rs7248668, rs8105790, rs8099917) and TNFRSF1B (rs1061622) genotypes, as well as TNFRSF1B/IL-10/TNFα (-308) non-TTG and TNFRSF1B/IL-10/IL-4 non-TTC haplotypes together with lower age, lower basal HCV RNA load, higher basal serum LDL cholesterol values, VHC genotypes 2 and 3 and basal low grade fibrosis 0-2 were associated with a SVR in the univariate analysis. Independent predictors of SVR in the multivariate analysis were IL-28B rs12979860 CC, TNFRSF1B/IL-10/IL-4 non-TTC along with low baseline HCV RNA load and HCV genotypes 2 and 3.
ConclusionsIL-28B rs12979860 CC, TNFRSF1B/ IL-10/ IL-4 non-TTC haplotype, low baseline HCV RNA load and HCV genotypes 2 and 3 may help to predict successful outcome to PEG-IFN/ribavirin therapy in Spanish population.
El interferón-a pegilado (IFN-PEG) junto a ribavirina ha sido el principal tratamiento de la infección por el virus de la hepatitis C (VHC) de la última década. Los agentes antivirales de acción directa actuales han mejorado los resultados de la terapia, pero también han aumentado el costo y la gestión de la complejidad del tratamiento. El presente estudio analiza factores genéticos de los pacientes, así como predictores virales y clínicos de respuesta sostenida viral (RSV) al tratamiento con IFN-PEG y ribavirina en población Española.
MétodosEstudio farmacogenético, multicéntrico, prospectivo, observacional de cohortes realizado en 12 hospitales diferentes de 12 comunidades autónomas diferentes. Se incluyeron un total de 98 pacientes con RVS y 106 sin SVR al tratamiento con IFN-PEG y ribavirina. Se seleccionaron 33 polimorfismos de nucleótido único ubicados en 24 genes diferentes relacionados con la respuesta inflamatoria, inmunológica y viral. Los datos clínicos y virales también se analizaron como candidatos predictores de RVS.
ResultadosLos genotipos IL-28B (rs12979860, rs7248668, rs8105790, rs8099917) y TNFRSF1B (rs1061622), así como los haplotipos TNFRSF1B / IL-10 / TNFα (-308) no-TTG y TNFRSF1B / IL-10 / IL-4 no-TTC junto con la menor edad, menor carga de ARN-VHC basal, valores elevados de colesterol LDL en suero basal, genotipos VHC2 y 3 y bajo grado de fibrosis basal (0-2) se asociaron con una RVS en el análisis univariante. Los predictores independientes de RVS en el análisis multivariante fueron el genotipo IL-28B rs12979860 CC, el haplotipo TNFRSF1B / IL-10 / IL-4 no-TTC junto con los bajos niveles basales de VHC-ARN y los genotipos virales VHC2 y 3.
ConclusionesEl genotipo IL-28B rs12979860 CC, el haplotipo TNFRSF1B / IL-10 / IL-4 haplotipos no-TTC, la carga viral basal baja y los genotipos del VHC2 y 3 pueden ayudar a predecir una buena respuesta a la terapia con IFN-PEG y ribavirina en población española.
Hepatitis C virus (HCV) infection is a major global health problem affecting approximately 170 million people worldwide1. The prevalence varies notably from nearly 0.1%-1% in Europe until the 5% in Asia and Africa2,3. More than 20 % of these patients will progress to cirrhosis, hepatocellular carcinoma, liver transplantation or death4. Therefore, all patients are candidates for antiviral therapy. Dual PEGylated interferon α (PEG-IFN) ribavirin therapy has been the main HCV treatment of the last decade. However, the percentage of patients achieving a sustained virologic response (SVR), defined as undetectable HCV RNA 24 weeks after completion of treatment, is below target especially for the difficult to treat HCV genotypes 1 and 4 with dual therapy. Recently, a number of direct-acting antiviral agents (DAAs) have been developed for use with PEG-IFN/ribavirin as triple or IFN-free therapies. The first DAAs generation boceprevir and telaprevir in combination with PEG-IFN/ribavirin increased the SVR rates to 66%-75% in previously untreated HCV1 adults vs. 38% in the PEG-IFN/ribavirin group5,6. Although triple therapy has improved SVR rates, these combinations have some drawbacks, including drug-drug interactions, a low efficacy in patients with HCV 2, 3 and 4 genotypes and in those who have not responded to previous dual PEG-IFN/ribavirin therapy. In this respect, second-generation protease inhibitors, such as simeprevir, asunaprevir, and danoprevir, are currently being evaluated or used in combination with PEG-IFN/ribavirin in an effort to overcome the limited efficacy of the first-generation protease inhibitors7,9. In addition, new inhibitors of the NS5A/NS5B HCV polymerase ledipasvir and sofosbuvir are currently available as part of PEG-IFN/ribavirin triple therapy as well as in IFN-free dual therapy10.
Understanding the host and viral factors associated with viral clearance is necessary for individualizing therapy to maximize SVR rates, prevent progression to liver disease, and increase the overall benefits of therapy with respect to its prohibitive costs.
The SVR rate varies drastically among different races and ethnicities, with patients of African ancestry having much lower response rates as compared with Caucasians and Asians, supporting genetic predisposition to response11. Both host and viral factors have been previously reported to be associated with SVR. Predictors of SVR include HCV genotypes 2 and 3, lower baseline serum HCV RNA level, younger age, female sex, lower hepatic fibrosis stage, lack of insulin resistance, and lower body mass index12. Host genetics is increasingly recognized as important modulator of the therapy success. Genome-wide association studies have shown that single nucleotide polymorphisms (SNPs) in or near the interleukin-28B (IL-28B) gene are significantly associated with the treatment outcome for HCV-113. Therefore, the assessment of the host IL28B genotype is increasingly used among HCV genotype-1 patients to inform clinical prediction of treatment outcome14. More specifically, the rs12979860 and rs8099917 SNPs were the two most examined: they were found in linkage disequilibrium each other, and to be similarly informative as host predictors of sustained viral clearance. In a recent meta-analysis of results from nine studies regarding the correlation of IL28B genotype with PEG-IFN/ribavirin SVR in 3110 Caucasian HCV-1 patients, the favourable IL28B genotype CC was present in 41% of individuals, and 67% of them achieved SVR compared to 37% of those with the unfavourable genotypes15. Other pharmacogenetic studies have been performed in different populations, showing a broad number of SNPs located in different genes of the host immune response, inflammatory, fibrosis and virus response pathways to be associated with the SVR to PEG-IFN/ribavirin dual therapy16. Although genetic markers are used as predictors of PEG-IFN/ribavirin in clinics, these only explain the 60-70% of SVR in Caucasian population. Given the recent introduction of multiple new DAAs, HCV treatment options have increased in parallel to its elevated costs, making difficult the optimal treatment decision. Pharmacogenetic studies of specific populations together with the analysis of different clinical variables may be of potential value to appropriately select candidates for dual PEG-IFN/ribavirin therapy in the era of new DAAs.
The present study was designed to analyze the predictive value of different SNPs located at different host immune, inflammatory and liver fibrotic genes in a representative multicenter Spanish cohort of responders and non-responder HCV patients treated with PEG-IFN/ribavirin therapy.
MethodsStudy Design and PopulationThis is an observational prospective multicentre pharmacogenetic cohort study conducted in 12 different hospitals of 12 different Spanish regions (Valencia, Alicante, Cartagena, A Coruña, Córdoba, Navarra, Salamanca, Lleida, Barcelona, Madrid, Tenerife, Las palmas de Gran Canaria) considered as a representative national population. Each hospital recruited 10 VHC patients who reached SVR and 10 VHC patients who showed no response to double PEG-IFN/ribavirin therapy reaching a total of 240 patients. The follow up study period was between February 2010 and June 2013, and included 24 weeks of follow up after the end of PEG-IFN/ribavirin therapy. Inclusion criteria were: 1) older than 18 years, 2) HCV 1-4 positive diagnosis, 3) PEG-IFN/ribavirin dual therapy, 3) clinical data available for liver enzymes, lipid profile, drug adherence, and VHC viral load at baseline, and every 12 weeks until the end of follow up, 5) stored whole blood samples for genetic determinations. Exclusion criteria were: 1) Patients who interrupted treatment because of adverse events or who voluntarily dropped out, 2) patients who infected with hepatitis B virus or human immunodeficiency virus were excluded, 3) loss of more than 20% of clinical data referred in inclusion criteria, 4) loss of more than 20% of genotyping data.
All HCV infected patients enrolled in this investigation agreed to donate a blood sample for genotyping, after having signed an informed consent. This study was approved by the Ethical Committee of the General University Hospital (Valencia), Complejo Hospitalario Universitario A Coruña (Galicia), Reina Sofía Hospital (Córdoba), General Hospital (Alicante), University Clinical Hospital (Salamanca), University Clinic (Navarra), General University Hospital of Santa Lucía (Cartagena), Gregorio Marañon Hospital (Madrid), University Hospital of Bellvitge (Catalunya), University Hospital Arnau de Vilanova (Lleida), University Hospital Complejo INSULAR Materno-Infantil (Las Palmas de Gran Canaria) and University Hospital Nuestra Señora de Candelaria (Tenerife), and conducted according to provisions of the Declaration of Helsinki and Good Clinical Practice Guidelines.
Treatment regimens and definition of responsePEG-IFN alfa-2a or alfa-2b was administered at doses of 180μg or 1.5μg/kg once per week, respectively, in combination with weight-adjusted ribavirin (1000 mg/day for <75 kg and 1200 mg/day for ≥75 kg). The scheduled treatment duration was 24 weeks for HCV2 and HCV3 genotype patients and 48 weeks for HCV1 genotype patients. SVR was defined as undetectable plasma HCV RNA 24 weeks after the completion of therapy. A decline of plasma HCV RNA of less than 2 log10 at week 12 or lack of undetectable HCV RNA at treatment week 24 after having presented an at least 2 log10 decline but without reaching undetectability was considered as non-response.
Selection and genotyping of single-nucleotide polymorphisms and HCV RNA quantification
Genomic DNA was isolated from whole blood samples using the QIAamp DNA Blood Maxi Kit (Qiagen GmbH, Hilden, Germany). Selected SNPs included SNPs belonging to genes involved in the immune host response, inflammatory pathways, liver function and fibrosis and inflammatory cell signaling previously associated with SVR or with liver inflammation/ fibrosis in HCV-infected patients (see supplementary table 1)16,17.
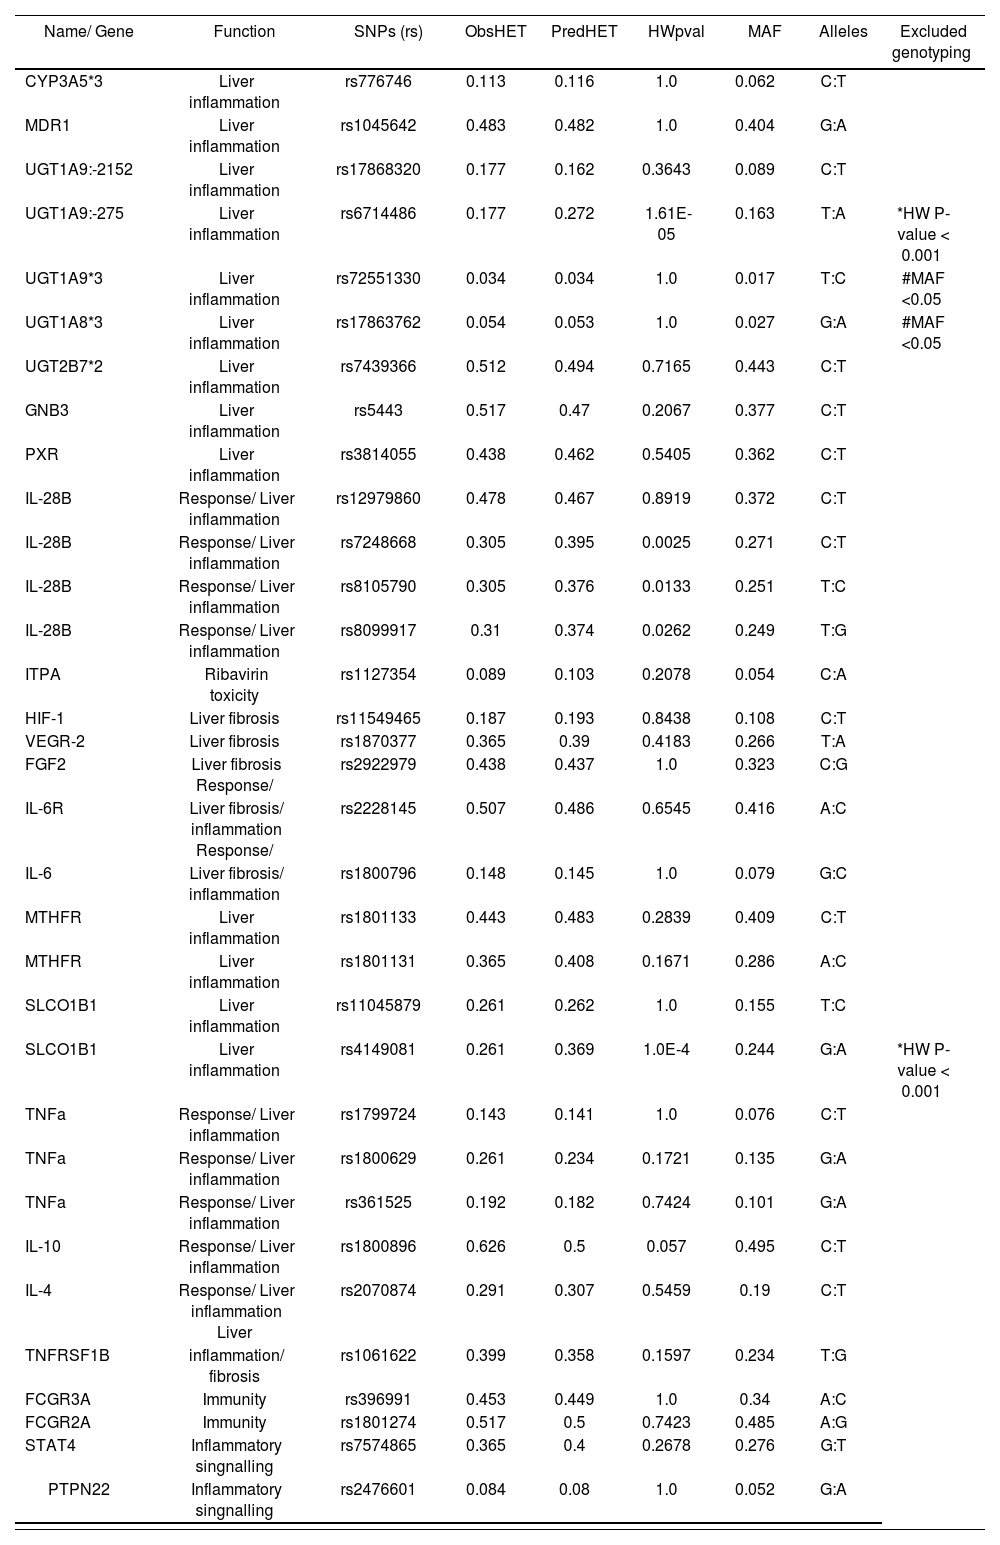
Single nucleotide polymorphisms (SNPs) selected for genotyping
| Name/ Gene | Function | SNPs (rs) | ObsHET | PredHET | HWpval | MAF | Alleles | Excluded genotyping |
|---|---|---|---|---|---|---|---|---|
| CYP3A5*3 | Liver inflammation | rs776746 | 0.113 | 0.116 | 1.0 | 0.062 | C:T | |
| MDR1 | Liver inflammation | rs1045642 | 0.483 | 0.482 | 1.0 | 0.404 | G:A | |
| UGT1A9:-2152 | Liver inflammation | rs17868320 | 0.177 | 0.162 | 0.3643 | 0.089 | C:T | |
| UGT1A9:-275 | Liver inflammation | rs6714486 | 0.177 | 0.272 | 1.61E-05 | 0.163 | T:A | *HW P-value < 0.001 |
| UGT1A9*3 | Liver inflammation | rs72551330 | 0.034 | 0.034 | 1.0 | 0.017 | T:C | #MAF <0.05 |
| UGT1A8*3 | Liver inflammation | rs17863762 | 0.054 | 0.053 | 1.0 | 0.027 | G:A | #MAF <0.05 |
| UGT2B7*2 | Liver inflammation | rs7439366 | 0.512 | 0.494 | 0.7165 | 0.443 | C:T | |
| GNB3 | Liver inflammation | rs5443 | 0.517 | 0.47 | 0.2067 | 0.377 | C:T | |
| PXR | Liver inflammation | rs3814055 | 0.438 | 0.462 | 0.5405 | 0.362 | C:T | |
| IL-28B | Response/ Liver inflammation | rs12979860 | 0.478 | 0.467 | 0.8919 | 0.372 | C:T | |
| IL-28B | Response/ Liver inflammation | rs7248668 | 0.305 | 0.395 | 0.0025 | 0.271 | C:T | |
| IL-28B | Response/ Liver inflammation | rs8105790 | 0.305 | 0.376 | 0.0133 | 0.251 | T:C | |
| IL-28B | Response/ Liver inflammation | rs8099917 | 0.31 | 0.374 | 0.0262 | 0.249 | T:G | |
| ITPA | Ribavirin toxicity | rs1127354 | 0.089 | 0.103 | 0.2078 | 0.054 | C:A | |
| HIF-1 | Liver fibrosis | rs11549465 | 0.187 | 0.193 | 0.8438 | 0.108 | C:T | |
| VEGR-2 | Liver fibrosis | rs1870377 | 0.365 | 0.39 | 0.4183 | 0.266 | T:A | |
| FGF2 | Liver fibrosis Response/ | rs2922979 | 0.438 | 0.437 | 1.0 | 0.323 | C:G | |
| IL-6R | Liver fibrosis/ inflammation Response/ | rs2228145 | 0.507 | 0.486 | 0.6545 | 0.416 | A:C | |
| IL-6 | Liver fibrosis/ inflammation | rs1800796 | 0.148 | 0.145 | 1.0 | 0.079 | G:C | |
| MTHFR | Liver inflammation | rs1801133 | 0.443 | 0.483 | 0.2839 | 0.409 | C:T | |
| MTHFR | Liver inflammation | rs1801131 | 0.365 | 0.408 | 0.1671 | 0.286 | A:C | |
| SLCO1B1 | Liver inflammation | rs11045879 | 0.261 | 0.262 | 1.0 | 0.155 | T:C | |
| SLCO1B1 | Liver inflammation | rs4149081 | 0.261 | 0.369 | 1.0E-4 | 0.244 | G:A | *HW P-value < 0.001 |
| TNFa | Response/ Liver inflammation | rs1799724 | 0.143 | 0.141 | 1.0 | 0.076 | C:T | |
| TNFa | Response/ Liver inflammation | rs1800629 | 0.261 | 0.234 | 0.1721 | 0.135 | G:A | |
| TNFa | Response/ Liver inflammation | rs361525 | 0.192 | 0.182 | 0.7424 | 0.101 | G:A | |
| IL-10 | Response/ Liver inflammation | rs1800896 | 0.626 | 0.5 | 0.057 | 0.495 | C:T | |
| IL-4 | Response/ Liver inflammation Liver | rs2070874 | 0.291 | 0.307 | 0.5459 | 0.19 | C:T | |
| TNFRSF1B | inflammation/ fibrosis | rs1061622 | 0.399 | 0.358 | 0.1597 | 0.234 | T:G | |
| FCGR3A | Immunity | rs396991 | 0.453 | 0.449 | 1.0 | 0.34 | A:C | |
| FCGR2A | Immunity | rs1801274 | 0.517 | 0.5 | 0.7423 | 0.485 | A:G | |
| STAT4 | Inflammatory singnalling | rs7574865 | 0.365 | 0.4 | 0.2678 | 0.276 | G:T | |
| PTPN22 | Inflammatory singnalling | rs2476601 | 0.084 | 0.08 | 1.0 | 0.052 | G:A |
*SNPs with Hardy-Weinberg-Equilibrium (HW) P-value <0.001; **SNPs with minor allele frequency (MAF) <0.05; ObsHET: Observed heterozygosity; PredHET: Predicted heterozygosity.
All SNPs were genotyped using allelic discrimination technique by means of real time PCR analysis in a 7900HT Fast Real-Time PCR System (Applied Biosystem, Foster City, CA, USA) using TaqMan® GTXpressTM Master Mix (Applied Biosystems) and 5′exonuclease TaqMan genotyping predesigned assays according to manufacturer’s instructions (Applied Biosystems). HCV genotyping was performed using the Inno-LiPA assay (Innogenetics, Zwijndrecht, Belgium). Serum HCV RNA was quantified by reverse transcription-PCR, using the Cobas Amplicor HCV Monitor Test, v 2.0 (Roche, Basel, Switzerland).
Data analysisA descriptive analysis of the baseline variables was conducted. Before statistical analysis, normality distribution and homogeneity of the variables were tested by the Kolmogorov-Smirnov test. Continuous variables were expressed as mean ± SD or median (interquartile range), depending on its distribution, and discrete variables were expressed as percentage. Haploview V4.1 Software (Error! Hyperlink reference not valid.www.broad.harvard.edu/haploview/haploview) was used to calculate the Hardy-Weinberg equilibrium for all SNPs using the χ2 goodness-of-fit test. Those gene SNPs with a minor frequency allele less than 5% or a P-value of the Hardy-Weinberg equilibrium below 0.001 were excluded from the analysis.
Those SNPs that were associated with SVR showing a P-value less than 0.05 were selected for further analysis. The linkage disequilibrium values between the genetic markers studied (measured in Lewontin’s standardized disequilibrium coefficient D’), haplotype frequencies and haplotype-based association analyses were calculated using Haploview V4.1. Student’s T test or Mann-Whitney U test was used to compare normally distributed continuous variables with every type of virological response (SVR and non-SVR). Comparisons of qualitative variables, including genotype, allele frequencies, clinical, analytical and therapy variables, with the different types of virological response were analyzed by the χ2 test. Odds ratios (OR) and confidence intervals (CI 95%) were calculated using Woolf approximation. A multivariate logistic regression analysis, including as covariables age, HCV genotype as well as those factors that were associated with SVR with a P-value less than 0.05 in the univariate analysis, was conducted. Descriptive analyses were carried out using the SPSS statistical software package release 20.0 (IBM Corporation, Somers, New York, USA).
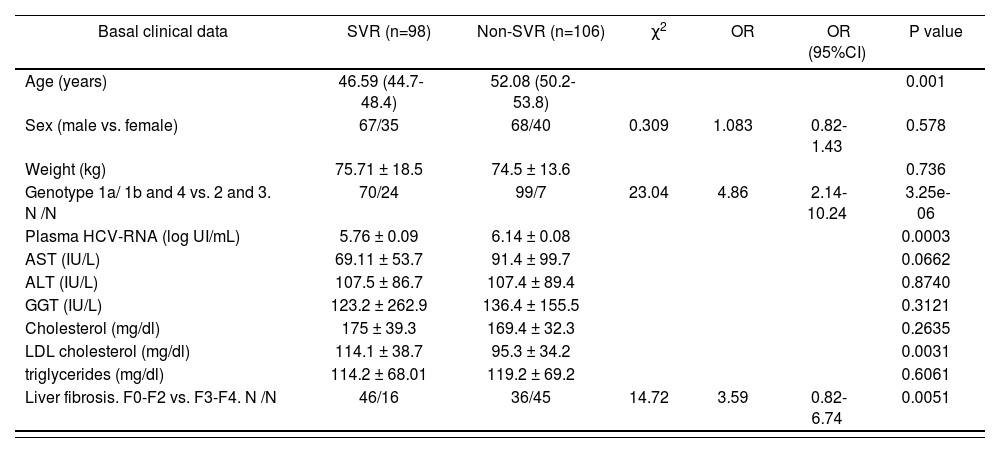
ResultsPatientsA total of 240 patients fulfilled the inclusion criteria for this study. Of these, 36 (15%) individuals were excluded because the loss of more than 20% of clinical data (18 patients), loss of more than 20% of genotyping data (7 patients) or due to the blood coagulation of sample (11 patients). Finally, 204 patients were included in the final analysis. After the end of follow-up, 98 (48 %) showed a SVR and 106 (52 %) showed a non-SVR to dual PEG-IFN/ribavirin therapy. Clinical characteristic of patients with SVR and non-SVR are showed in Table 1. The cohort of patients with SVR showed significant lower age (46.59 (44.7-48.4) vs. 52.08 (50.2-53.8) years old; P<0.05), lower basal HCV RNA load (5.76 ± 0.09 vs. 6.14 ± 0.08 log UI/mL; P<0.05) and higher basal serum LDL cholesterol values (114.1 ± 38.7 vs. 95.3 ± 34.2 mg/dL; P<0.05) compared with non-SVR patients. Furthermore the VHC genotypes 2 and 3 (OR (95% CI): 4.86 (2.14-10.24) P=3.25e-06) and basal low grade fibrosis 0-2 (OR (95% CI): 3.59 (0.82-6.74) P=0.0051) were associated with a SVR (table 1). No other differences were found between clinical characteristics of patients with SVR and non-SVR.lower basal HCV RNA load (5.76 ± 0.09 vs. 6.14 ± 0.08 log UI/mL; P<0.05) and higher basal serum LDL cholesterol values (114.1 ± 38.7 vs. 95.3 ± 34.2 mg/dL; P<0.05) compared with non-SVR patients. Furthermore the VHC genotypes 2 and 3 (OR (95% CI): 4.86 (2.14-10.24) P=3.25e-06) and basal low grade fibrosis 0-2 (OR (95% CI): 3.59 (0.82-6.74) P=0.0051) were associated with a SVR (table 1). No other differences were found between clinical characteristics of patients with SVR and non-SVR.
Main basal demographic and clinical characteristics of the groups studied
| Basal clinical data | SVR (n=98) | Non-SVR (n=106) | χ2 | OR | OR (95%CI) | P value |
|---|---|---|---|---|---|---|
| Age (years) | 46.59 (44.7-48.4) | 52.08 (50.2-53.8) | 0.001 | |||
| Sex (male vs. female) | 67/35 | 68/40 | 0.309 | 1.083 | 0.82-1.43 | 0.578 |
| Weight (kg) | 75.71 ± 18.5 | 74.5 ± 13.6 | 0.736 | |||
| Genotype 1a/ 1b and 4 vs. 2 and 3. N /N | 70/24 | 99/7 | 23.04 | 4.86 | 2.14-10.24 | 3.25e-06 |
| Plasma HCV-RNA (log UI/mL) | 5.76 ± 0.09 | 6.14 ± 0.08 | 0.0003 | |||
| AST (IU/L) | 69.11 ± 53.7 | 91.4 ± 99.7 | 0.0662 | |||
| ALT (IU/L) | 107.5 ± 86.7 | 107.4 ± 89.4 | 0.8740 | |||
| GGT (IU/L) | 123.2 ± 262.9 | 136.4 ± 155.5 | 0.3121 | |||
| Cholesterol (mg/dl) | 175 ± 39.3 | 169.4 ± 32.3 | 0.2635 | |||
| LDL cholesterol (mg/dl) | 114.1 ± 38.7 | 95.3 ± 34.2 | 0.0031 | |||
| triglycerides (mg/dl) | 114.2 ± 68.01 | 119.2 ± 69.2 | 0.6061 | |||
| Liver fibrosis. F0-F2 vs. F3-F4. N /N | 46/16 | 36/45 | 14.72 | 3.59 | 0.82-6.74 | 0.0051 |
Abbreviations: SNP, single nucleotide polymorphism; SVR, sustained virological response; OR, odds ratio; CI, confidence interval. Comparisons of qualitative variables with the different types of virological response were analyzed by the χ2 test. Mann-Whitney U test was used to compare normally distributed continuous variables with every type of virological response. Odds ratios and 95% CI per genotype were estimated by applying unconditional logistic regression. The P values less than 0.05 were considered significant. Values are expressed as mean ± SD or mean (interquartile range).
Single-nucleotide polymorphisms selection and association with SVR to PEG-IFN/ribavirin treatment
A total of 33 SNPs located in 24 different genes related with inflammatory response, immune response, response to virus and liver fibrosis were selected for the primary analysis (supplementary Table 1). Of these, 4 SNPs were excluded as a result of either a minor allele frequency below 0.05 (2 SNPs), or a P-value of the Hardy-Weinberg equilibrium below 0.001 (2 SNPs). Other 29 SNPs were in Hardy-Weinberg equilibrium indicating that no population stratification bias or genotyping error existed.
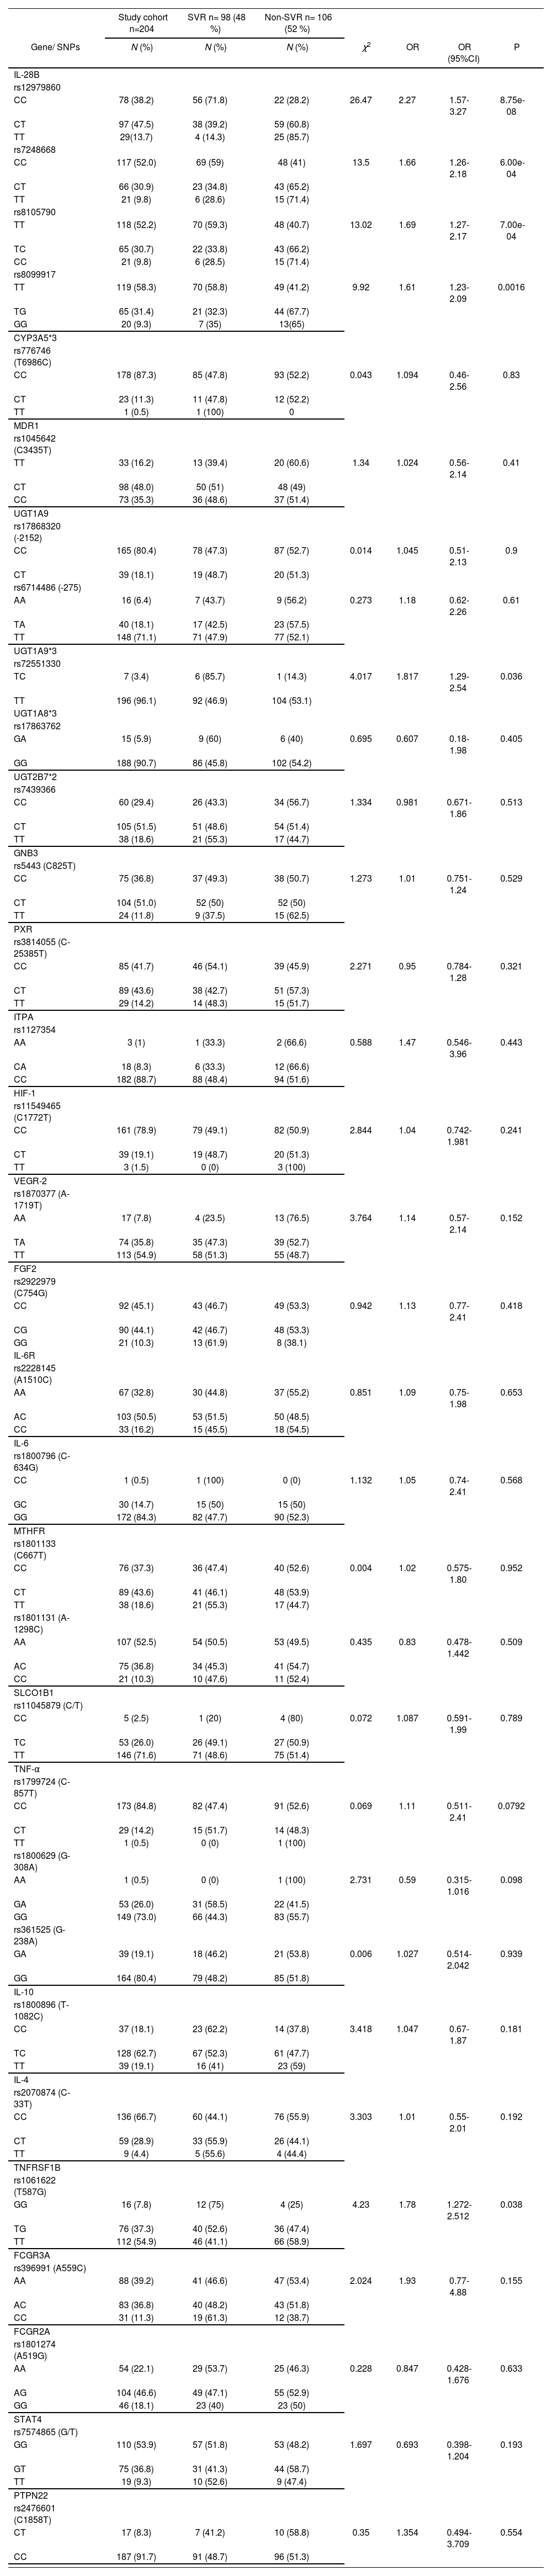
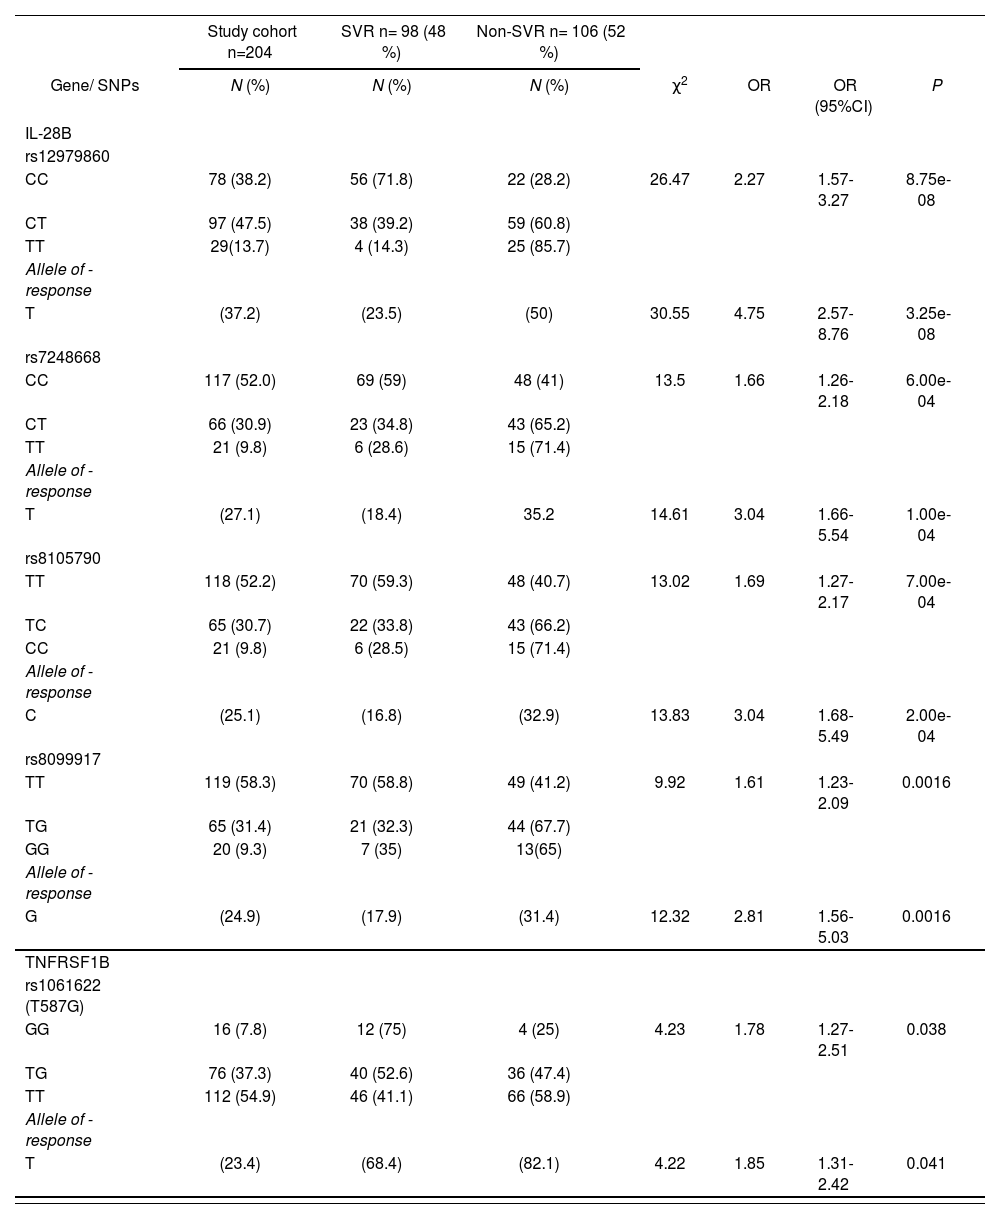
After distribution analysis of different SNPs between patients with SVR and non-SVR we only observed a significant association with the SVR in the IL-28B gene (rs12979860, rs7248668, rs8105790, rs8099917), TN-FRSF1B (rs1061622) and UGT1A9*3 (rs72551330) as represented in supplementary table 2 and table 2. In the last case, the UGT1A9*3 rs72551330 was discarded because of the low prevalence of its favorable genotype TC (3.4%).
Genotype frequencies of single nucleotide polymorphisms in HCV infected PEG-IFNα-ribavirin therapy patients with and without SVR
| Study cohort n=204 | SVR n= 98 (48 %) | Non-SVR n= 106 (52 %) | |||||
|---|---|---|---|---|---|---|---|
| Gene/ SNPs | N (%) | N (%) | N (%) | χ2 | OR | OR (95%CI) | P |
| IL-28B | |||||||
| rs12979860 | |||||||
| CC | 78 (38.2) | 56 (71.8) | 22 (28.2) | 26.47 | 2.27 | 1.57-3.27 | 8.75e-08 |
| CT | 97 (47.5) | 38 (39.2) | 59 (60.8) | ||||
| TT | 29(13.7) | 4 (14.3) | 25 (85.7) | ||||
| rs7248668 | |||||||
| CC | 117 (52.0) | 69 (59) | 48 (41) | 13.5 | 1.66 | 1.26-2.18 | 6.00e-04 |
| CT | 66 (30.9) | 23 (34.8) | 43 (65.2) | ||||
| TT | 21 (9.8) | 6 (28.6) | 15 (71.4) | ||||
| rs8105790 | |||||||
| TT | 118 (52.2) | 70 (59.3) | 48 (40.7) | 13.02 | 1.69 | 1.27-2.17 | 7.00e-04 |
| TC | 65 (30.7) | 22 (33.8) | 43 (66.2) | ||||
| CC | 21 (9.8) | 6 (28.5) | 15 (71.4) | ||||
| rs8099917 | |||||||
| TT | 119 (58.3) | 70 (58.8) | 49 (41.2) | 9.92 | 1.61 | 1.23-2.09 | 0.0016 |
| TG | 65 (31.4) | 21 (32.3) | 44 (67.7) | ||||
| GG | 20 (9.3) | 7 (35) | 13(65) | ||||
| CYP3A5*3 | |||||||
| rs776746 (T6986C) | |||||||
| CC | 178 (87.3) | 85 (47.8) | 93 (52.2) | 0.043 | 1.094 | 0.46-2.56 | 0.83 |
| CT | 23 (11.3) | 11 (47.8) | 12 (52.2) | ||||
| TT | 1 (0.5) | 1 (100) | 0 | ||||
| MDR1 | |||||||
| rs1045642 (C3435T) | |||||||
| TT | 33 (16.2) | 13 (39.4) | 20 (60.6) | 1.34 | 1.024 | 0.56-2.14 | 0.41 |
| CT | 98 (48.0) | 50 (51) | 48 (49) | ||||
| CC | 73 (35.3) | 36 (48.6) | 37 (51.4) | ||||
| UGT1A9 | |||||||
| rs17868320 (-2152) | |||||||
| CC | 165 (80.4) | 78 (47.3) | 87 (52.7) | 0.014 | 1.045 | 0.51-2.13 | 0.9 |
| CT | 39 (18.1) | 19 (48.7) | 20 (51.3) | ||||
| rs6714486 (-275) | |||||||
| AA | 16 (6.4) | 7 (43.7) | 9 (56.2) | 0.273 | 1.18 | 0.62-2.26 | 0.61 |
| TA | 40 (18.1) | 17 (42.5) | 23 (57.5) | ||||
| TT | 148 (71.1) | 71 (47.9) | 77 (52.1) | ||||
| UGT1A9*3 | |||||||
| rs72551330 | |||||||
| TC | 7 (3.4) | 6 (85.7) | 1 (14.3) | 4.017 | 1.817 | 1.29-2.54 | 0.036 |
| TT | 196 (96.1) | 92 (46.9) | 104 (53.1) | ||||
| UGT1A8*3 | |||||||
| rs17863762 | |||||||
| GA | 15 (5.9) | 9 (60) | 6 (40) | 0.695 | 0.607 | 0.18-1.98 | 0.405 |
| GG | 188 (90.7) | 86 (45.8) | 102 (54.2) | ||||
| UGT2B7*2 | |||||||
| rs7439366 | |||||||
| CC | 60 (29.4) | 26 (43.3) | 34 (56.7) | 1.334 | 0.981 | 0.671-1.86 | 0.513 |
| CT | 105 (51.5) | 51 (48.6) | 54 (51.4) | ||||
| TT | 38 (18.6) | 21 (55.3) | 17 (44.7) | ||||
| GNB3 | |||||||
| rs5443 (C825T) | |||||||
| CC | 75 (36.8) | 37 (49.3) | 38 (50.7) | 1.273 | 1.01 | 0.751-1.24 | 0.529 |
| CT | 104 (51.0) | 52 (50) | 52 (50) | ||||
| TT | 24 (11.8) | 9 (37.5) | 15 (62.5) | ||||
| PXR | |||||||
| rs3814055 (C-25385T) | |||||||
| CC | 85 (41.7) | 46 (54.1) | 39 (45.9) | 2.271 | 0.95 | 0.784-1.28 | 0.321 |
| CT | 89 (43.6) | 38 (42.7) | 51 (57.3) | ||||
| TT | 29 (14.2) | 14 (48.3) | 15 (51.7) | ||||
| ITPA | |||||||
| rs1127354 | |||||||
| AA | 3 (1) | 1 (33.3) | 2 (66.6) | 0.588 | 1.47 | 0.546-3.96 | 0.443 |
| CA | 18 (8.3) | 6 (33.3) | 12 (66.6) | ||||
| CC | 182 (88.7) | 88 (48.4) | 94 (51.6) | ||||
| HIF-1 | |||||||
| rs11549465 (C1772T) | |||||||
| CC | 161 (78.9) | 79 (49.1) | 82 (50.9) | 2.844 | 1.04 | 0.742-1.981 | 0.241 |
| CT | 39 (19.1) | 19 (48.7) | 20 (51.3) | ||||
| TT | 3 (1.5) | 0 (0) | 3 (100) | ||||
| VEGR-2 | |||||||
| rs1870377 (A-1719T) | |||||||
| AA | 17 (7.8) | 4 (23.5) | 13 (76.5) | 3.764 | 1.14 | 0.57-2.14 | 0.152 |
| TA | 74 (35.8) | 35 (47.3) | 39 (52.7) | ||||
| TT | 113 (54.9) | 58 (51.3) | 55 (48.7) | ||||
| FGF2 | |||||||
| rs2922979 (C754G) | |||||||
| CC | 92 (45.1) | 43 (46.7) | 49 (53.3) | 0.942 | 1.13 | 0.77-2.41 | 0.418 |
| CG | 90 (44.1) | 42 (46.7) | 48 (53.3) | ||||
| GG | 21 (10.3) | 13 (61.9) | 8 (38.1) | ||||
| IL-6R | |||||||
| rs2228145 (A1510C) | |||||||
| AA | 67 (32.8) | 30 (44.8) | 37 (55.2) | 0.851 | 1.09 | 0.75-1.98 | 0.653 |
| AC | 103 (50.5) | 53 (51.5) | 50 (48.5) | ||||
| CC | 33 (16.2) | 15 (45.5) | 18 (54.5) | ||||
| IL-6 | |||||||
| rs1800796 (C-634G) | |||||||
| CC | 1 (0.5) | 1 (100) | 0 (0) | 1.132 | 1.05 | 0.74-2.41 | 0.568 |
| GC | 30 (14.7) | 15 (50) | 15 (50) | ||||
| GG | 172 (84.3) | 82 (47.7) | 90 (52.3) | ||||
| MTHFR | |||||||
| rs1801133 (C667T) | |||||||
| CC | 76 (37.3) | 36 (47.4) | 40 (52.6) | 0.004 | 1.02 | 0.575-1.80 | 0.952 |
| CT | 89 (43.6) | 41 (46.1) | 48 (53.9) | ||||
| TT | 38 (18.6) | 21 (55.3) | 17 (44.7) | ||||
| rs1801131 (A-1298C) | |||||||
| AA | 107 (52.5) | 54 (50.5) | 53 (49.5) | 0.435 | 0.83 | 0.478-1.442 | 0.509 |
| AC | 75 (36.8) | 34 (45.3) | 41 (54.7) | ||||
| CC | 21 (10.3) | 10 (47.6) | 11 (52.4) | ||||
| SLCO1B1 | |||||||
| rs11045879 (C/T) | |||||||
| CC | 5 (2.5) | 1 (20) | 4 (80) | 0.072 | 1.087 | 0.591-1.99 | 0.789 |
| TC | 53 (26.0) | 26 (49.1) | 27 (50.9) | ||||
| TT | 146 (71.6) | 71 (48.6) | 75 (51.4) | ||||
| TNF-α | |||||||
| rs1799724 (C-857T) | |||||||
| CC | 173 (84.8) | 82 (47.4) | 91 (52.6) | 0.069 | 1.11 | 0.511-2.41 | 0.0792 |
| CT | 29 (14.2) | 15 (51.7) | 14 (48.3) | ||||
| TT | 1 (0.5) | 0 (0) | 1 (100) | ||||
| rs1800629 (G-308A) | |||||||
| AA | 1 (0.5) | 0 (0) | 1 (100) | 2.731 | 0.59 | 0.315-1.016 | 0.098 |
| GA | 53 (26.0) | 31 (58.5) | 22 (41.5) | ||||
| GG | 149 (73.0) | 66 (44.3) | 83 (55.7) | ||||
| rs361525 (G-238A) | |||||||
| GA | 39 (19.1) | 18 (46.2) | 21 (53.8) | 0.006 | 1.027 | 0.514-2.042 | 0.939 |
| GG | 164 (80.4) | 79 (48.2) | 85 (51.8) | ||||
| IL-10 | |||||||
| rs1800896 (T-1082C) | |||||||
| CC | 37 (18.1) | 23 (62.2) | 14 (37.8) | 3.418 | 1.047 | 0.67-1.87 | 0.181 |
| TC | 128 (62.7) | 67 (52.3) | 61 (47.7) | ||||
| TT | 39 (19.1) | 16 (41) | 23 (59) | ||||
| IL-4 | |||||||
| rs2070874 (C-33T) | |||||||
| CC | 136 (66.7) | 60 (44.1) | 76 (55.9) | 3.303 | 1.01 | 0.55-2.01 | 0.192 |
| CT | 59 (28.9) | 33 (55.9) | 26 (44.1) | ||||
| TT | 9 (4.4) | 5 (55.6) | 4 (44.4) | ||||
| TNFRSF1B | |||||||
| rs1061622 (T587G) | |||||||
| GG | 16 (7.8) | 12 (75) | 4 (25) | 4.23 | 1.78 | 1.272-2.512 | 0.038 |
| TG | 76 (37.3) | 40 (52.6) | 36 (47.4) | ||||
| TT | 112 (54.9) | 46 (41.1) | 66 (58.9) | ||||
| FCGR3A | |||||||
| rs396991 (A559C) | |||||||
| AA | 88 (39.2) | 41 (46.6) | 47 (53.4) | 2.024 | 1.93 | 0.77-4.88 | 0.155 |
| AC | 83 (36.8) | 40 (48.2) | 43 (51.8) | ||||
| CC | 31 (11.3) | 19 (61.3) | 12 (38.7) | ||||
| FCGR2A | |||||||
| rs1801274 (A519G) | |||||||
| AA | 54 (22.1) | 29 (53.7) | 25 (46.3) | 0.228 | 0.847 | 0.428-1.676 | 0.633 |
| AG | 104 (46.6) | 49 (47.1) | 55 (52.9) | ||||
| GG | 46 (18.1) | 23 (40) | 23 (50) | ||||
| STAT4 | |||||||
| rs7574865 (G/T) | |||||||
| GG | 110 (53.9) | 57 (51.8) | 53 (48.2) | 1.697 | 0.693 | 0.398-1.204 | 0.193 |
| GT | 75 (36.8) | 31 (41.3) | 44 (58.7) | ||||
| TT | 19 (9.3) | 10 (52.6) | 9 (47.4) | ||||
| PTPN22 | |||||||
| rs2476601 (C1858T) | |||||||
| CT | 17 (8.3) | 7 (41.2) | 10 (58.8) | 0.35 | 1.354 | 0.494-3.709 | 0.554 |
| CC | 187 (91.7) | 91 (48.7) | 96 (51.3) |
Abbreviations: SNP, single nucleotide polymorphism; SVR, sustained virological response; OR, odds ratio; CI, confidence interval. Genotype frequencies were determined by χ2 test using 3 × 2 or 2 × 2 tables as appropriate. Odds ratios and 95% CI per genotype were estimated by applying unconditional logistic regression. The P values less than 0.05 were considered significant.
Genotype frequencies of single nucleotide polymorphisms in HCV infected PEG-IFNα-ribavirin therapy patients with and without SVR
| Study cohort n=204 | SVR n= 98 (48 %) | Non-SVR n= 106 (52 %) | |||||
|---|---|---|---|---|---|---|---|
| Gene/ SNPs | N (%) | N (%) | N (%) | χ2 | OR | OR (95%CI) | P |
| IL-28B | |||||||
| rs12979860 | |||||||
| CC | 78 (38.2) | 56 (71.8) | 22 (28.2) | 26.47 | 2.27 | 1.57-3.27 | 8.75e-08 |
| CT | 97 (47.5) | 38 (39.2) | 59 (60.8) | ||||
| TT | 29(13.7) | 4 (14.3) | 25 (85.7) | ||||
| Allele of -response | |||||||
| T | (37.2) | (23.5) | (50) | 30.55 | 4.75 | 2.57-8.76 | 3.25e-08 |
| rs7248668 | |||||||
| CC | 117 (52.0) | 69 (59) | 48 (41) | 13.5 | 1.66 | 1.26-2.18 | 6.00e-04 |
| CT | 66 (30.9) | 23 (34.8) | 43 (65.2) | ||||
| TT | 21 (9.8) | 6 (28.6) | 15 (71.4) | ||||
| Allele of -response | |||||||
| T | (27.1) | (18.4) | 35.2 | 14.61 | 3.04 | 1.66-5.54 | 1.00e-04 |
| rs8105790 | |||||||
| TT | 118 (52.2) | 70 (59.3) | 48 (40.7) | 13.02 | 1.69 | 1.27-2.17 | 7.00e-04 |
| TC | 65 (30.7) | 22 (33.8) | 43 (66.2) | ||||
| CC | 21 (9.8) | 6 (28.5) | 15 (71.4) | ||||
| Allele of -response | |||||||
| C | (25.1) | (16.8) | (32.9) | 13.83 | 3.04 | 1.68-5.49 | 2.00e-04 |
| rs8099917 | |||||||
| TT | 119 (58.3) | 70 (58.8) | 49 (41.2) | 9.92 | 1.61 | 1.23-2.09 | 0.0016 |
| TG | 65 (31.4) | 21 (32.3) | 44 (67.7) | ||||
| GG | 20 (9.3) | 7 (35) | 13(65) | ||||
| Allele of -response | |||||||
| G | (24.9) | (17.9) | (31.4) | 12.32 | 2.81 | 1.56-5.03 | 0.0016 |
| TNFRSF1B | |||||||
| rs1061622 (T587G) | |||||||
| GG | 16 (7.8) | 12 (75) | 4 (25) | 4.23 | 1.78 | 1.27-2.51 | 0.038 |
| TG | 76 (37.3) | 40 (52.6) | 36 (47.4) | ||||
| TT | 112 (54.9) | 46 (41.1) | 66 (58.9) | ||||
| Allele of -response | |||||||
| T | (23.4) | (68.4) | (82.1) | 4.22 | 1.85 | 1.31-2.42 | 0.041 |
Abbreviations: SNP, single nucleotide polymorphism; SVR, sustained virological response; OR, odds ratio; CI, confidence interval. Genotype frequencies were determined by χ2 test using 3 × 2 or 2 × 2 tables as appropriate. Odds ratios and 95% CI per genotype were estimated by applying unconditional logistic regression. The P values less than 0.05 were considered significant.
The prediction power for SVR differed among the five SNPs: the CC homozygous genotype of IL28B rs12979860 SNP was more strongly associated (OR (95% CI): 2.27 (1.57-3.27) P=8.75e-08 for CC vs. CT/TT) than the CC genotype of rs7248668 (OR (95% CI): 1.66 (1.26-2.18) P=6.00e-04 for CC vs. CT/TT), the TT genotype of rs8105790 (OR (95% CI): 1.69 (1.27-2.17) P= 7.00e-04 for TT vs. TC/CC), the TT genotype of rs8099917 (OR (95% CI): 1.61 (1.23-2.09) P= 0.0016 for TT vs. TG/GG) or the TNFRSF1B GG genotype of rs1061622 (OR (95% CI): 1.78 (1.27-2.51) P= 7.00e-04 for GG vs. TG/TT) as show Table 2.
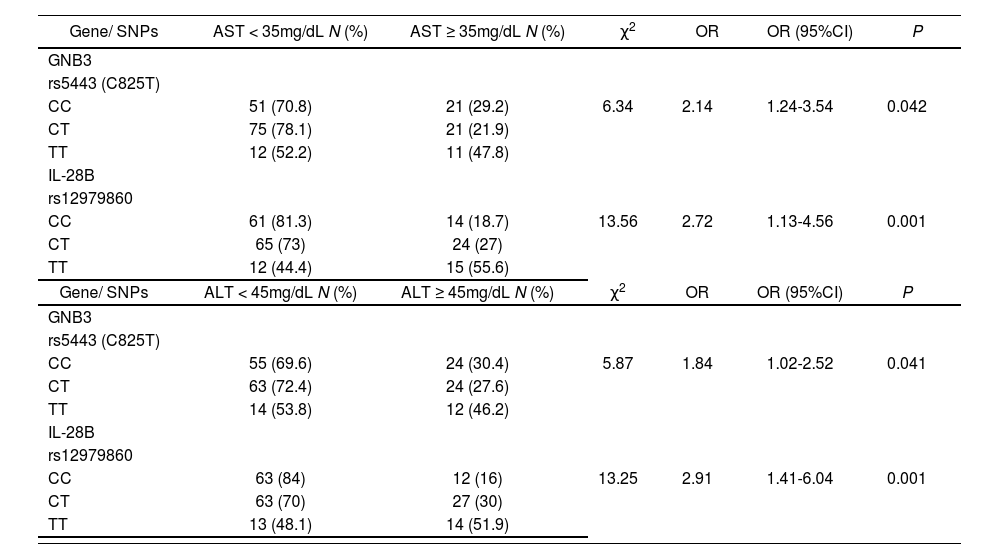
HCV active infection is accompanied by chronic liver inflammation which may be monitored by simple hepatic enzyme serum analysis. In this work, both cohorts of responders and non-responder patients showed similar elevated aspartate transaminase (AST) and alanine aminotransferase (ALT) hepatic enzymes (table 1). Host genetic SNPs located in IL28B (rs12979860) and in GNB3 (rs5443) were associated with AST and ALT normalization on week 12 of treatment independently of the final response to treatment (table 3) suggesting a positive influence on the hepatic anti-inflammatory role of the PEG-IFN/ribavirin treatment.
Genotype frequencies of single nucleotide polymorphisms in HCV infected PEG-IFNα-ribavirin treated patients who normalized serum hepatic enzyme values after 12 weeks of treatment.
| Gene/ SNPs | AST < 35mg/dL N (%) | AST ≥ 35mg/dL N (%) | χ2 | OR | OR (95%CI) | P |
|---|---|---|---|---|---|---|
| GNB3 | ||||||
| rs5443 (C825T) | ||||||
| CC | 51 (70.8) | 21 (29.2) | 6.34 | 2.14 | 1.24-3.54 | 0.042 |
| CT | 75 (78.1) | 21 (21.9) | ||||
| TT | 12 (52.2) | 11 (47.8) | ||||
| IL-28B | ||||||
| rs12979860 | ||||||
| CC | 61 (81.3) | 14 (18.7) | 13.56 | 2.72 | 1.13-4.56 | 0.001 |
| CT | 65 (73) | 24 (27) | ||||
| TT | 12 (44.4) | 15 (55.6) | ||||
| Gene/ SNPs | ALT < 45mg/dL N (%) | ALT ≥ 45mg/dL N (%) | χ2 | OR | OR (95%CI) | P |
| GNB3 | ||||||
| rs5443 (C825T) | ||||||
| CC | 55 (69.6) | 24 (30.4) | 5.87 | 1.84 | 1.02-2.52 | 0.041 |
| CT | 63 (72.4) | 24 (27.6) | ||||
| TT | 14 (53.8) | 12 (46.2) | ||||
| IL-28B | ||||||
| rs12979860 | ||||||
| CC | 63 (84) | 12 (16) | 13.25 | 2.91 | 1.41-6.04 | 0.001 |
| CT | 63 (70) | 27 (30) | ||||
| TT | 13 (48.1) | 14 (51.9) |
Abbreviations: SNP, single nucleotide polymorphism; SVR, sustained virological response; OR, odds ratio; CI, confidence interval; AST: aspartate transaminase; ALT: alanine aminotransferase. Genotype frequencies were determined by χ2 test using 3 × 2 or 2 × 2 tables as appropriate. Odds ratios and 95% CI per genotype were estimated by applying unconditional logistic regression. The P values less than 0.05 were considered significant.
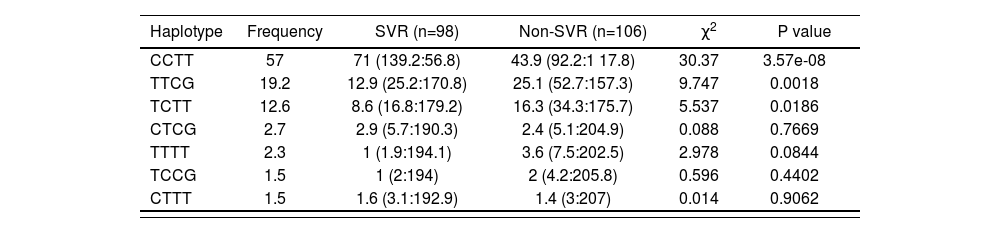
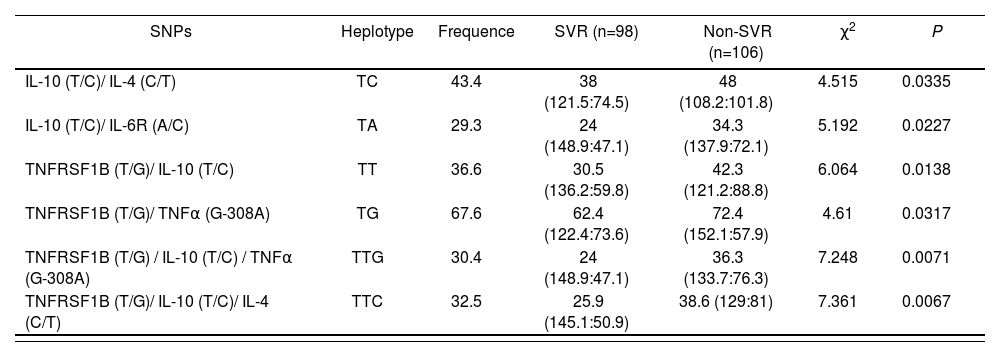
After analysing the linkage disequilibrium among the polymorphisms studied, only a moderate association of IL28B rs12979860 with an IL28B rs7248668, rs8105790 and IL28B rs8099917 (D’< 0.8) and strong association of IL28B rs7248668, rs8105790 and IL28B rs8099917 (D’< 0.8; Figure 1) were found. The reconstructed haplotypes of the IL-28B polymorphisms did not improved the predictive value of rs12979860 (table 4) suggesting an independent predictive value for each IL-28B SNP. Next analysis was designed to detect potential genegene interactions between combinations of 2 or 3 different SNPs. Table 5 shows the association of different gene-gene interactions with the SVR to dual PEG-IFN/ribavirin therapy. Different inflammatory and immune response pathways such as the IL-10/IL-4 and IL-10/IL-6R haplotypes as well as interactions with the TNFRSF1B gene with IL-10, IL-4 and TNFa genes were significantly associated with SVR (table 5).
 pattern of IL28B region.")
IL28B haplotype frequencies constructed with SNPs in HCV-infected groups (rs12979860, rs7248668, rs8105790, rs8099917)
| Haplotype | Frequency | SVR (n=98) | Non-SVR (n=106) | χ2 | P value |
|---|---|---|---|---|---|
| CCTT | 57 | 71 (139.2:56.8) | 43.9 (92.2:1 17.8) | 30.37 | 3.57e-08 |
| TTCG | 19.2 | 12.9 (25.2:170.8) | 25.1 (52.7:157.3) | 9.747 | 0.0018 |
| TCTT | 12.6 | 8.6 (16.8:179.2) | 16.3 (34.3:175.7) | 5.537 | 0.0186 |
| CTCG | 2.7 | 2.9 (5.7:190.3) | 2.4 (5.1:204.9) | 0.088 | 0.7669 |
| TTTT | 2.3 | 1 (1.9:194.1) | 3.6 (7.5:202.5) | 2.978 | 0.0844 |
| TCCG | 1.5 | 1 (2:194) | 2 (4.2:205.8) | 0.596 | 0.4402 |
| CTTT | 1.5 | 1.6 (3.1:192.9) | 1.4 (3:207) | 0.014 | 0.9062 |
Abbreviations: SVR, sustained virological response. The P-values were calculated from chi-squared (χ2) test.
Haplotype frequencies constructed with SNPs in HCV-infected groups (IL-10 rs1800896 (T/C); IL-4 rs2070874 (C/T); IL-6R rs2228145 (A/C); TNFRSF1B rs1061622 (T/G); TNFα rs1800629 (G-308A)
| SNPs | Heplotype | Frequence | SVR (n=98) | Non-SVR (n=106) | χ2 | P |
|---|---|---|---|---|---|---|
| IL-10 (T/C)/ IL-4 (C/T) | TC | 43.4 | 38 (121.5:74.5) | 48 (108.2:101.8) | 4.515 | 0.0335 |
| IL-10 (T/C)/ IL-6R (A/C) | TA | 29.3 | 24 (148.9:47.1) | 34.3 (137.9:72.1) | 5.192 | 0.0227 |
| TNFRSF1B (T/G)/ IL-10 (T/C) | TT | 36.6 | 30.5 (136.2:59.8) | 42.3 (121.2:88.8) | 6.064 | 0.0138 |
| TNFRSF1B (T/G)/ TNFα (G-308A) | TG | 67.6 | 62.4 (122.4:73.6) | 72.4 (152.1:57.9) | 4.61 | 0.0317 |
| TNFRSF1B (T/G) / IL-10 (T/C) / TNFα (G-308A) | TTG | 30.4 | 24 (148.9:47.1) | 36.3 (133.7:76.3) | 7.248 | 0.0071 |
| TNFRSF1B (T/G)/ IL-10 (T/C)/ IL-4 (C/T) | TTC | 32.5 | 25.9 (145.1:50.9) | 38.6 (129:81) | 7.361 | 0.0067 |
Abbreviations: SVR, sustained virological response. The P-values were calculated from chi-squared (χ2) test.
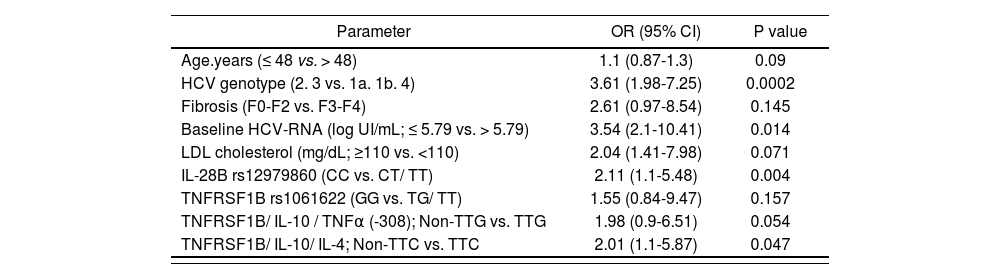
According to the univariate analysis, SNPs in IL-28B (rs12979860, rs7248668, rs8105790, rs8099917) and TNFRSF1B (rs1061622) genes, as well as the haplotypes TNFRSF1B/IL-10/TNFa (-308) TTG and TNFRSF1B/IL-10/IL-4 TTC, were entered into a multivariate logistic regression model adjusted for age, HCV genotype, presence of advanced fibrosis, HCV baseline viral load and basal LDL cholesterol values. In the multivariate analysis TNFR-SF1B/ IL-10/ IL-4 non-TTC was independently associated with SVR along with IL28B rs12979860 CC genotype, low baseline HCV RNA load and HCV genotypes 2 and 3 (Table 6). No independent association was detected for IL-(rs7248668, rs8105790, rs8099917) or TNFRSF1B (rs1061622), although the TNFRSF1B/IL-10/TNFα (-308) non-TTG was near to be significant (P=0.054).
Independent predictors of SVR in patients who completed the treatment regimen with PEG-IFNα and ribavirin
| Parameter | OR (95% CI) | P value |
|---|---|---|
| Age.years (≤ 48 vs. > 48) | 1.1 (0.87-1.3) | 0.09 |
| HCV genotype (2. 3 vs. 1a. 1b. 4) | 3.61 (1.98-7.25) | 0.0002 |
| Fibrosis (F0-F2 vs. F3-F4) | 2.61 (0.97-8.54) | 0.145 |
| Baseline HCV-RNA (log UI/mL; ≤ 5.79 vs. > 5.79) | 3.54 (2.1-10.41) | 0.014 |
| LDL cholesterol (mg/dL; ≥110 vs. <110) | 2.04 (1.41-7.98) | 0.071 |
| IL-28B rs12979860 (CC vs. CT/ TT) | 2.11 (1.1-5.48) | 0.004 |
| TNFRSF1B rs1061622 (GG vs. TG/ TT) | 1.55 (0.84-9.47) | 0.157 |
| TNFRSF1B/ IL-10 / TNFα (-308); Non-TTG vs. TTG | 1.98 (0.9-6.51) | 0.054 |
| TNFRSF1B/ IL-10/ IL-4; Non-TTC vs. TTC | 2.01 (1.1-5.87) | 0.047 |
Abbreviations: SVR, sustained virological response; OR, odds ratio; CI, confidence interval; pegIFNα: pegylated interferon alpha.OR of having a SVR to PEG-IFNα-ribavirin therapy were calculated. P values less than 0.05 were considered statistically significant.
Different DAAs have been approved recently for HCV infection. These compounds used in different combinations, including PEG-INF-based triple therapies to INF-free oral bitherapies, have increased SVR rates even above 90%18. In this scenario, host genetics might become appropriate to target patients who could more likely respond to conventional dual therapy with PEG-IFN and ribavirin which represents an efficient tool to individualize therapy.
The present work is a pharmacogenetic study conducted in a representative Spanish population of two cohorts of HCV infected patients who reached SVR and non-SVR to dual PEG-IFN and ribavirin therapy. In addition to well-known loci on the IL-28B gene, the previously unobserved SNPs located in the TNFRSF1B (rs1061622) and in different IL-10/ IL-4/ IL-6R/TNFα haplotypes were shown to have a significant association with the outcome of HCV treatment using PEG-IFNα and ribavirin. After multivariate analysis, the IL-28B rs12979860 CC genotype and TNFRSF1B/ IL-10/ IL-4 non-TTC haplotype were independently associated with SVR along with low baseline HCV RNA load and HCV genotypes 2 and 3 which may help to predict successful outcome in Spanish population.
Many studies over the last three decades have evaluated genetic predictors of HCV treatment response. Although the IL-28B genotype has emerged as the strongest predictor of treatment response, a recent systematic review found that more than thirty genes have been associated with treatment response to INF-based therapies16. In this study we found an independent SVR predictive value for the IL-28B rs12979860 CC genotype but not for the rs7248668, rs8105790 or rs8099917 SNPs mainly because they are in linkage disequilibrium with rs12979860. It has been commented before the importance of the ethnicity to predict SVR. In fact, IL-28B frequency in each different SNP varies depending of the ethnicity which explains different responses to dual PEG-IFN/ribavirin treatment. Thus, for example, the Asian population shows a favorable 77% rs12979860 CC genotype distribution vs. 38% in Caucasian and 15% in African population which reflects the highest SVR of the Asian population13,19,20. In addition, the most powerful IL-28B rs8099917 genotype predicts near to 90% of SVR in Asian population13 while in Caucasian population the best predictor was rs12979860 with a 60-70% of predictive value. Although Spanish population belongs to Caucasian ethnicity, to our knowledge there are no studies with a representative Spanish population from different regions which may add some variation to the current data. In this work we observed a 38.2% of rs12979860 CC genotype distribution in the general population studied, similar to the previously described in Caucasian population. Patients with SVR showed a 71.8% of rs12979860 CC genotype vs. 28.2% of non-responders, slightly lower than in general Caucasian population of the original studies13. Furthermore, the rs8099917 favorable TT genotype was the worst predictive IL-28B SNP. In terms of clinical use, the haplotype analysis revealed that combining all IL-28B SNPs results did not improve the strength of the association between the IL-28B genotype and SVR as compared with the results using rs12979860 genotype alone as recently was observed in other populations21. Cytokines and chemokines which are secreted by immune cells contribute to viral control, or liver damage. Examples are INFα/β, INFγ, TNFα, IL-6, IL-10, IL-4 and transforming growth factor beta (TGFβ) between others22. They are able to render uninfected cells resistant to infection and cure the infected ones from the virus by stopping viral replication. In fact, PEG-INF-based therapy mimics the effect of host defense against HCV, increasing the expression of interferon stimulated genes (ISG) to kill HCV. In this regard, recent works have shown an association of different SNPs on TNFα (rs1800629), TGFβ (rs1800469), IL-6 (rs1800797), IL-10 (rs1800896) and IL-4 (rs2070874) with SVR to PEG-INF ribavirin therapy16,23 which highlight the importance of an optimal host genetic anti-viral response for success of dual therapy.
TNF-α can bind to two different receptors: TNFRSF1A (tumour necrosis factor receptor superfamily 1A) and TN-FRSF1B (tumour necrosis factor receptor superfamily 1B); which activates NF-κB and triggers several inflammatory pathways with anti-viral properties24,25. Rs1061622 is located in the exon 6 of TNFRSF1B, and the change of T to G causes a functional amino acid substitution at codon 196 from methionine (Met) to arginine (Arg) in the translated protein TNF receptor 2 (TNFR2). This variant G is supposed to produce a change of biological function of the TNFR2 protein affecting TNF-a binding and NF-κB activation which consequently modifies INF I and III production25. Interestingly, in some drug sensitivity studies, rs1061622 was found to be associated with a favorable prognosis of non-small cell lung cancer patients treated with chemoradiotherapy26 and with a beneficial response to infliximab in Crohn’s disease27. In this work, it was observed for the first time an association of the TNFR-SF1B rs1061622 G allele with a SVR. In the same way, different haplotypes combining IL-10, IL-6R, TNFα and IL-4 cytokines increased the predictive value of TNFRS-F1B rs1061622, indicating that anti-viral inflammatory response is a complex molecular process which encompasses a broad number of inflammatory cells and molecular pathways. In fact, TNFRSF1B/ IL-10/ IL-4 non-TTC hplotype reached significant association with SVR in the multivariate analysis.
As part of the different inflammatory pathways involved in HCV liver inflammation, GNB3 rs5443 CC genotype, which encodes a splice variant of the β3 subunit of heterotrimeric G proteins, has been associated with an inactivation of GNB3, thus reducing the activation of broad number of inflammatory receptors coupled to GNB3. This fact, may explain rapid normalization of AST and ALT hepatic enzymes in GNB3 CC carriers observed in this work, although no association with SVR was observed.
However, as we commented before, host genetics cannot explain the 100% of SVR. There are other clinical and viral factors that influence the response to PEG-IFN/ribavirin treatment. In this work we observed an association of lower age, lower basal HCV-RNA load, HCV2 and HCV3 genotypes, lower fibrosis stage F0-F2, and elevated LDL cholesterol with a SVR, which confirm previous reports28,29. However, the multivariate analysis independently associated lower basal HCV-RNA load, HCV 2 and 3 genotypes as predictors of SVR, probably because the study sample did not reach enough size.
In summary, we found genetic, viral an clinical parameters associated with SVR, particularly IL-28B rs12979860 CC, TNFRSF1B/ IL-10/ IL-4 non-TTC haplotype, low baseline HCV RNA load and HCV genotypes 2 and 3 which may help to predict successful outcome to PEG-IFN/ribavirin therapy in Spanish population. Further analysis would be required to confirm these associations with triple therapy including new DAAs.


Farmacia Hospitalaria sigue las recomendaciones para la preparación, presentación y publicación de trabajos académicos en revistas biomédicas
- Inicio
- Todos los contenidos
- Publique su artículo
- Acerca de la revista
- Métricas