


To reduce the alert fatigue in our Assisted Electronic Prescribing System (AEPS), through the Lean Six Sigma (LSS) methodology.
MethodAn observational (transversal) and retrospective study, in a general hospital with 850 beds and AEPS. The LSS methodology was followed in order to evaluate the alert fatigue situation in the AEPS system, to implement improvements, and to assess outcomes. The alerts generated during two trimesters studied (before and after the intervention) were analyzed.
In order to measure the qualitative indicators, the most frequent alert types were analyzed, as well as the molecules responsible for over 50% of each type of alert. The action by the prescriber was analyzed in a sample of 496 prescriptions that generated such alerts. For each type of alert and molecule, there was a prioritization of the improvements to be implemented according to the alert generated and its quality. A second survey evaluated the pharmacist action for the alerts most highly valued by physicians.
ResultsThe problem, the objective, the work team and the project schedule were defined. A survey was designed in order to understand the opinion of the client about the alert system in the program. Based on the surveys collected (n = 136), the critical characteristics and the quanti/qualitative indicators were defined.
Sixty (60) fields in the alert system were modified, corresponding to 32 molecules, and this led to a 28% reduction in the total number of alerts. Regarding quality indicators, false po-sitive results were reduced by 25% (p<0.05), 100% of those alerts ignored with justification were sustained, and there were no significant differences in user adherence to the system. The project improvements and outcomes were reviewed by the work team.
ConclusionsLSS methodology has demonstrated being a valid tool for the quantitative and qualitative improvement of the alert system in an Assisted Electronic Prescription Program, thus reducing alert fatigue.
Reducir la fatiga por alertas en nuestro sistema de prescripción electrónica asistida (PEA), mediante la metodología Lean Six Sigma (LSS).
MétodoEstudio observacional (transversal) y retrospectivo en un hospital general con 850 camas de hospitalización con PEA. Se siguió la metodología LSS para evaluar la situación de fatiga por alertas del sistema de PEA, implementar mejoras y evaluar resultados. Se analizaron las alertas generadas durante dos trimestres de estudio (pre y post-intervención).
Para medir los indicadores cualitativos se recurrió al análisis de los tipos de alerta más frecuentes y de los principios activos responsables de más del 50% de cada tipo de alerta. Se analizó la actuación del prescriptor en una muestra de 496 prescripciones que generaron estas alertas. Para cada tipo de alerta y principio activo se priorizaron las mejoras a implementar de acuerdo con la alerta generada y la calidad de la misma. La actuación farmacéutica ante las alertas más valoradas por los médicos se evaluó mediante una segunda encuesta.
ResultadosSe definió el problema, el objetivo, el grupo de trabajo y el cronograma del proyecto. Se diseñó una encuesta para conocer la opinión del cliente sobre el sistema de alertas del programa. A partir de las encuestas recogidas (n= 136) se definieron las características críticas y los indicadores cuanti/ cualitativos.
Se modificaron 60 campos del sistema de alertas, correspondientes a 32 principios activos, reduciéndose la cantidad total de alertas en un 28%. En cuanto a los indicadores de calidad, se redujeron los falsos positivos en un 25 % (p<0,05), se mantuvo el 100 % de alertas ignoradas de forma justificada, y no hubo diferencias significativas en la adherencia de los usuarios al sistema. Las mejoras y los resultados del proyecto fueron revisados por el grupo de trabajo.
ConclusionesLa metodología LSS ha demostrado ser una herramienta válida para la mejora cuantitativa y cualitativa del sistema de alertas de un programa de prescripción electrónica asistida, reduciendo así el fenómeno de la fatiga por alertas.
The objective of this original article was to reduce fatigue alert in our Assisted Electronic Prescription System, through the optimization in the number and quality of alerts, and the standardization of the pharmacist action when faced with the different types of alerts.
The fatigue alert we have detected in our daily practice is something frequent in Assisted Electronic Prescription (AEP) alert systems. It has been confirmed that many deficiencies are still identified, in spite of the wide experience and the literature available about the implementation of these systems. Moreover, there is a limited number of studies about their efficacy in terms of the relevance and quality of the information offered, as well as about the response of users to this information, and all this can compromise the efficacy and safety of the system.
We believe that the reason for both the originality and the relevance of these outcomes is the methodology followed, Lean Six Sigma, which presents the characteristic of being supported by a work team, that is to say, it requires consensus by users; and most of all, improvements are introduced according to the „Client Voice“ or user opinion. Regarding this, we consider that there was a enough level of participation (approximately 10% of hospital physicians).
This evaluation of the alert system by a high number of users, together with the analysis of the quality of the most frequent types of alert and the improvements implemented, will gradually generate valuable information about the real utility of alert systems in AEP programs.
IntroductionAssisted Electronic Prescription Systems (AEPS) represent, in the setting of safety improvement for patients, an important support tool for making clinical decisions at the time of prescription1.
These systems have had a significant development in recent years; therefore, besides a wide range of clinical information, the majority of them include a potent system of safety alerts. However, there are few studies on their efficacy, and their clinical benefits for patients have not always been demonstrated2,3,4,5.
It has been described that the alerts generated by an AEP system are ignored in up to 49-96% of cases3. This shows a problem in user adherence to recommendations; one of the main causes for this is the high number of alerts generated (between 34 and 90% of prescriptions); moreover, these are not always relevant, specific, and easy to manage. All this will lead to the development of „fatigue“6.
Peterson and Bates7 describe „alert fatigue“ as „the state of mind resulting from receiving too many alerts, which are time-consuming and require too much mental energy, and that can be the cause for some clinically relevant alerts to go unnoticed among other non-relevant alerts“. That is to say, there is a desensitization of the user, who ignores the alerts that are not important as well as those that are important, thus compromising the objective of these alerts, which is patient safety.
Our AEP system features various information and safety levels. Firstly, it provides basic information that will make prescription easier. Secondly, it conducts a basic check of the prescription, according to a knowledge base of reference (defined regimens, maximum dosing, maximum number of treatment days, interactions, contraindications and duplications). And finally, it includes an advance check that integrates relevant patient data, such as history of allergies and certain clinical conditions, even decision algorithms, such as the renal impairment module for dose adjustment in those medications that require it, and dosing based on body weight and/or age for paediatric patients. All this will generate alerts that appear interactively and/or as a report at the end of the prescription (this option can be set up by each user based on their preferences and experience). But the prescription is never blocked, and there is no obligation to justify the decision to ignore the alert; and therefore, there is no feedback that would be required for updating the system1.
Despite this, and the fact that there has been a selection of clinically significant alerts, and these have been customized according to the clinical situation of the patient and adverse event severity, the presence of alert fatigue has been detected in our daily practice. Therefore, it is necessary to improve the efficiency of the alert system, reducing the workload but without any negative impact on patient safety.
These improvements require consensus by users and clinical committee; they must be introduced cautiously and their results must be assessed. Therefore, this project has been developed following the Lean Six Sigma (LSS) methodology; its use is not widespread in the healthcare setting, but it has already provided some successful experiences8. Indeed, this is a scientific methodology for continuous quality improvement, supported by a work team, and understanding client needs. The key idea is to apply Lean tools to eliminate any unnecessary stages without any value (waste), and reduce the cycle times (efficiency), as well as the Six Sigma Techniques in order to reduce variability and deficiencies (effectiveness and safety)9.
The objective of the present article is to optimize the number and quality of alerts in our AEP program, to standardize the action by pharmacists when faced with different types of alerts, and to increase user satisfaction.
METHODSEthical aspectsThe project was authorized by the Head of Department („Champion“, according to the LSS methodology). Electronic records did not include any identification data for patients or healthcare professionals.
DesignAn observational, transversal and retrospective study. Improvements were implemented and outcomes were assessed by deploying the stages of the DMAIC (Define, Measure, Analyze, Improve, Control)9 cycle of the LSS methodology.
SettingA general hospital of reference with 1,000 beds, 850 of them with AEP, with over 1,000 licences for prescribing physicians, and 1,450 pharmaceutical products available in the system for prescription.
Population and sampleThe study included the alerts generated during two trimesters (before and after the intervention), obtained from the AEP system. For the qualitative analysis of the project, 496 prescriptions in total were reviewed.
Schedule of the DMAIC cycleThe LSS project was conducted between May, 2014 and May, 2015. It was structured on the DMAIC cycle stages.
In the Define Stage (May-June, 2014), the problem, objective, work team and project schedule were defined. The Work Team was formed by five users of the AEP system (4 pharmacists and 1 physician), an external observer physician, a pharmacist for methodological support, and the pharmacist managing the AEP system database, as group liaison.
According to the LSS methodology, the first step is learning the „Client Voice“ about the alert system in the program. For this aim, a survey was designed with six questions about the quantity and quality of alerts, as well as their attitude towards them; this survey was distributed to all physician and pharmacist users (specialists and residents). The survey was completely anonymous, although it included data about the clinical department and the professional category.
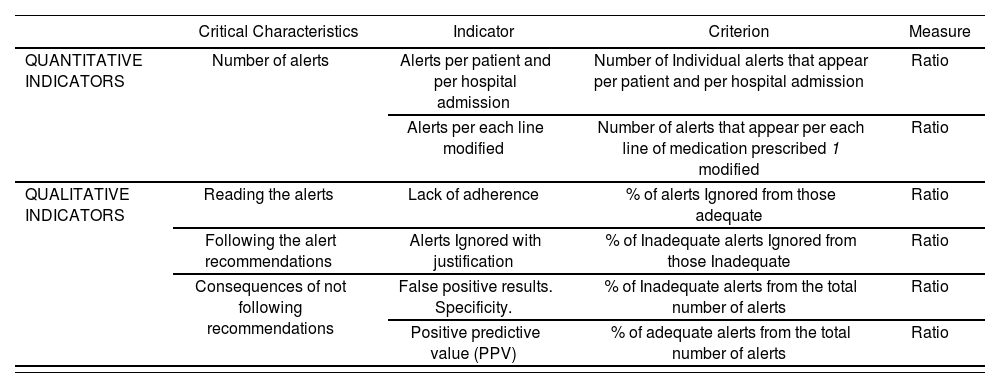
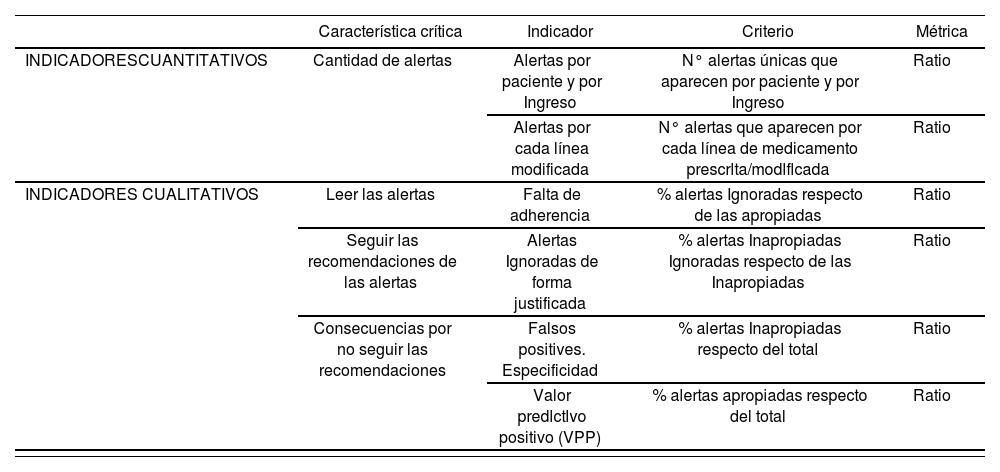
Based on the analysis of Client Voice, the „critical characteristics“ of the project were determined (LSS methodology), and those quantitative and qualitative indicators to be measured were defined (Table 1).
Critical characteristics derived from Client Voice and quantitative and qualitative indicators
| Critical Characteristics | Indicator | Criterion | Measure | |
|---|---|---|---|---|
| QUANTITATIVE INDICATORS | Number of alerts | Alerts per patient and per hospital admission | Number of Individual alerts that appear per patient and per hospital admission | Ratio |
| Alerts per each line modified | Number of alerts that appear per each line of medication prescribed 1 modified | Ratio | ||
| QUALITATIVE INDICATORS | Reading the alerts | Lack of adherence | % of alerts Ignored from those adequate | Ratio |
| Following the alert recommendations | Alerts Ignored with justification | % of Inadequate alerts Ignored from those Inadequate | Ratio | |
| Consequences of not following recommendations | False positive results. Specificity. | % of Inadequate alerts from the total number of alerts | Ratio | |
| Positive predictive value (PPV) | % of adequate alerts from the total number of alerts | Ratio |
In the „Measure, Analyze“ Stages (July-September, 2014), those alerts generated during the first trimester of 2014 were quantified, as well as the number of hospitalized patients and the number of lines of prescription modified during this period.
In order to measure the qualitative indicators, the most frequent types of alert were analyzed, as well as the molecules responsible for over 50% of each type of alert. A sample of the prescriptions generating these alerts was analyzed, from the perspective of alert relevance (whether adequate or not), and of the clinical action taken for these alerts (acceptance or not) (Figure 1).

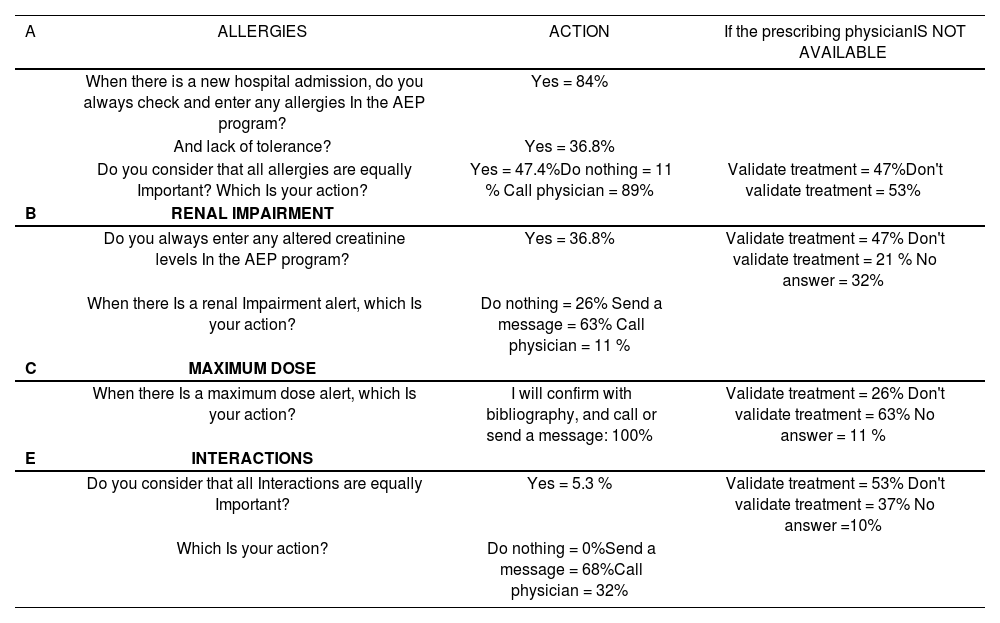
The pharmacist action for the alerts most valued by physicians was assessed through a second survey.
In the „Improve“ Stage (October-December 2014), it was considered to eliminate and modify those alerts that were no valuable, according to the predefined criteria for a good alert system3-6,10. For this aim, the improvements to be implemented were prioritized, and the work team reached a consensus. The initial objective established was the reduction by half of the alert load.
With the aim to reduce the variability in pharmacist action for different types of alert, a series of recommendations were made to the Pharmacy Team.
In the „Control“ Stage (January-May, 2015), the indicators were re-assessed, based on data extracted from the AEP system for the first trimester in 201 5, once the improvements had been implemented.
There was an estimation of the benefit in the reduction of the number of alerts, based on the assumption that the time required to read an alert is 1.7 seconds.
Statistical AnalysisThe two-proportion z-test.was used for the statistical analysis of the outcomes. The predetermined level of significance was 5%. The analysis was conducted with the statistical analysis G-Stat 2.0 program.
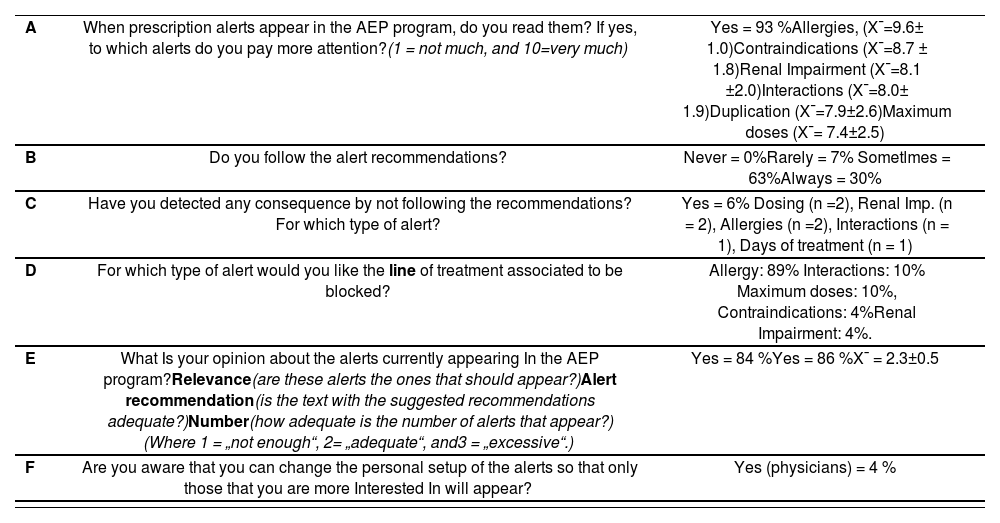
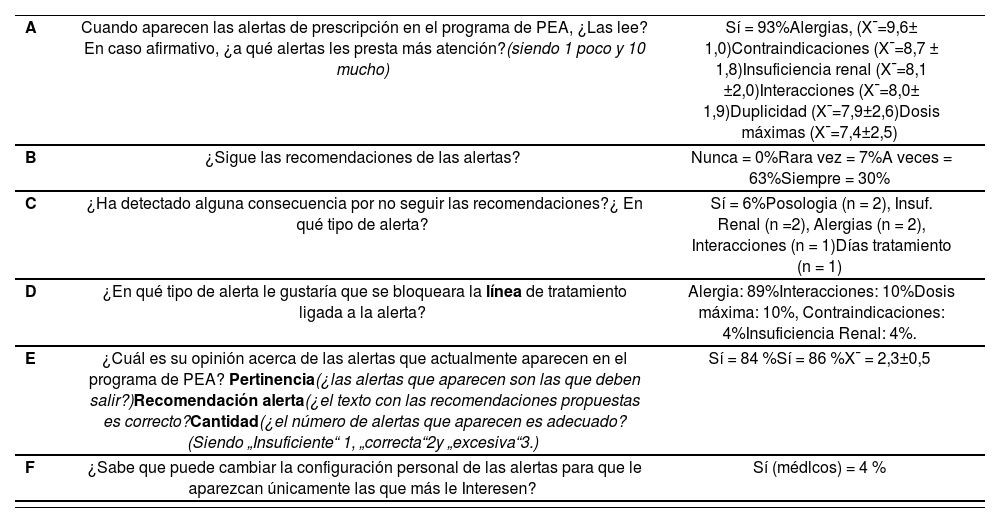
ResultsSurvey (Client Voice)In total, 136 surveys were collected from 24 clinical departments, both medical and surgical. A 69% of the participants were specialists, and 31% were residents. The results of the survey are shown in Table 2.
Results of the survey (Client Voice) on the alert system (n= 136)
| A | When prescription alerts appear in the AEP program, do you read them? If yes, to which alerts do you pay more attention?(1 = not much, and 10=very much) | Yes = 93 %Allergies, (X¯=9.6± 1.0)Contraindications (X¯=8.7 ± 1.8)Renal Impairment (X¯=8.1 ±2.0)Interactions (X¯=8.0± 1.9)Duplication (X¯=7.9±2.6)Maximum doses (X¯= 7.4±2.5) |
| B | Do you follow the alert recommendations? | Never = 0%Rarely = 7% Sometlmes = 63%Always = 30% |
| C | Have you detected any consequence by not following the recommendations? For which type of alert? | Yes = 6% Dosing (n =2), Renal Imp. (n = 2), Allergies (n =2), Interactions (n = 1), Days of treatment (n = 1) |
| D | For which type of alert would you like the line of treatment associated to be blocked? | Allergy: 89% Interactions: 10% Maximum doses: 10%, Contraindications: 4%Renal Impairment: 4%. |
| E | What Is your opinion about the alerts currently appearing In the AEP program?Relevance(are these alerts the ones that should appear?)Alert recommendation(is the text with the suggested recommendations adequate?)Number(how adequate is the number of alerts that appear?) (Where 1 = „not enough“, 2= „adequate“, and3 = „excessive“.) | Yes = 84 %Yes = 86 %X¯ = 2.3±0.5 |
| F | Are you aware that you can change the personal setup of the alerts so that only those that you are more Interested In will appear? | Yes (physicians) = 4 % |
X¯ = arithmetic mean standard deviation
These results were translated into the critical characteristics of the project, and an indicator was defined for each one, with its criterion and measurement (Table 1).
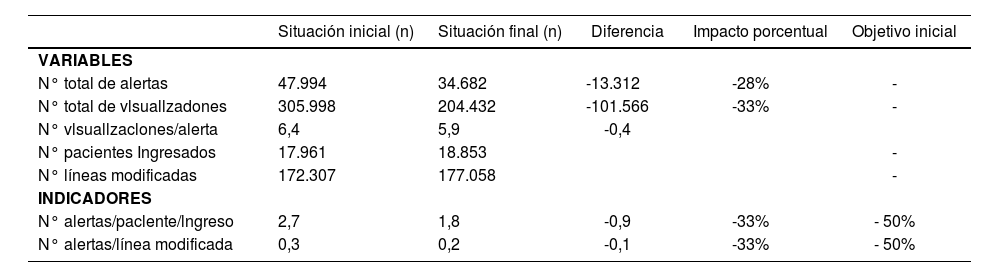
Initial situationDuring the first trimester in 2014, there were 47,994 different alerts; their rate of distribution by type of alert is shown in figure 2.

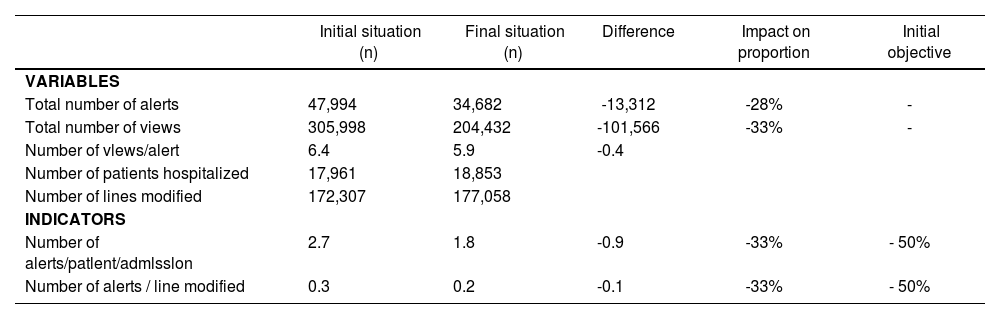
The results of the quantitative indicators appear in Table 3.
Quantitative Indicators
| Initial situation (n) | Final situation (n) | Difference | Impact on proportion | Initial objective | |
|---|---|---|---|---|---|
| VARIABLES | |||||
| Total number of alerts | 47,994 | 34,682 | -13,312 | -28% | - |
| Total number of views | 305,998 | 204,432 | -101,566 | -33% | - |
| Number of vlews/alert | 6.4 | 5.9 | -0.4 | ||
| Number of patients hospitalized | 17,961 | 18,853 | |||
| Number of lines modified | 172,307 | 177,058 | |||
| INDICATORS | |||||
| Number of alerts/patlent/admlsslon | 2.7 | 1.8 | -0.9 | -33% | - 50% |
| Number of alerts / line modified | 0.3 | 0.2 | -0.1 | -33% | - 50% |
For estimating the quality indicators, there was a selection of 71 out of 971 molecules (7.3%), responsible for over half of the alerts generated for each type of alert (58%). After the assessment of each type of alert, these could be classified into two groups:
- -
Alerts caused by software limitations: therapeutic duplication, dispensing conditions, and allergies.
- -
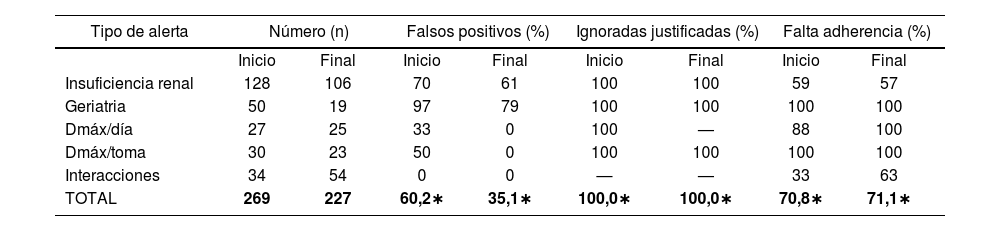
Alerts that represented a problem in the quality of the alert or the action by the user, such as those for renal impairment, geriatrics, maximum doses, or interactions. For their analysis, 269 prescriptions were reviewed, and the predefined quality indicators were estimated (Table 4).
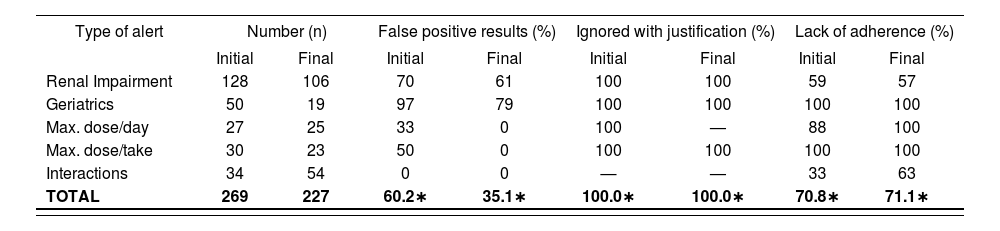
Table 4.Quality Indicators
Type of alert Number (n) False positive results (%) Ignored with justification (%) Lack of adherence (%) Initial Final Initial Final Initial Final Initial Final Renal Impairment 128 106 70 61 100 100 59 57 Geriatrics 50 19 97 79 100 100 100 100 Max. dose/day 27 25 33 0 100 — 88 100 Max. dose/take 30 23 50 0 100 100 100 100 Interactions 34 54 0 0 — — 33 63 TOTAL 269 227 60.2∗ 35.1∗ 100.0∗ 100.0∗ 70.8∗ 71.1∗ ∗Values weighted per sample size (n)
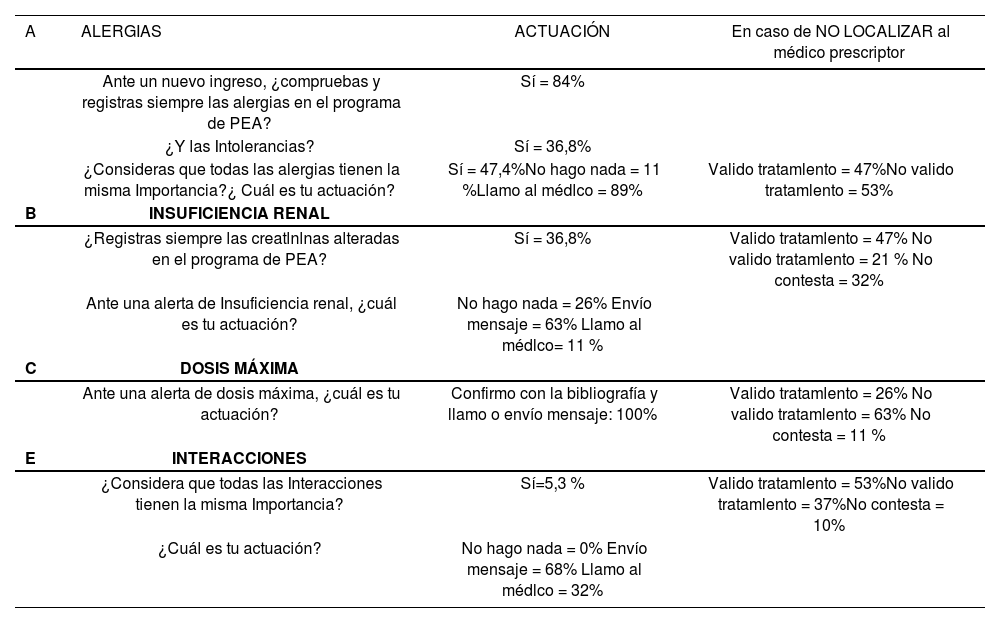
Table 5 shows the results of the survey on pharmacist action for those alerts valued as the most relevant by physicians; this survey was distributed among 19 Pharmacists (5 residents, 14 specialists).
Survey on Pharmacist action for the alerts most valued by physicians (n=19)
| A | ALLERGIES | ACTION | If the prescribing physicianIS NOT AVAILABLE |
|---|---|---|---|
| When there is a new hospital admission, do you always check and enter any allergies In the AEP program? | Yes = 84% | ||
| And lack of tolerance? | Yes = 36.8% | ||
| Do you consider that all allergies are equally Important? Which Is your action? | Yes = 47.4%Do nothing = 11 % Call physician = 89% | Validate treatment = 47%Don't validate treatment = 53% | |
| B | RENAL IMPAIRMENT | ||
| Do you always enter any altered creatinine levels In the AEP program? | Yes = 36.8% | Validate treatment = 47% Don't validate treatment = 21 % No answer = 32% | |
| When there Is a renal Impairment alert, which Is your action? | Do nothing = 26% Send a message = 63% Call physician = 11 % | ||
| C | MAXIMUM DOSE | ||
| When there Is a maximum dose alert, which Is your action? | I will confirm with bibliography, and call or send a message: 100% | Validate treatment = 26% Don't validate treatment = 63% No answer = 11 % | |
| E | INTERACTIONS | ||
| Do you consider that all Interactions are equally Important? | Yes = 5.3 % | Validate treatment = 53% Don't validate treatment = 37% No answer =10% | |
| Which Is your action? | Do nothing = 0%Send a message = 68%Call physician = 32% |
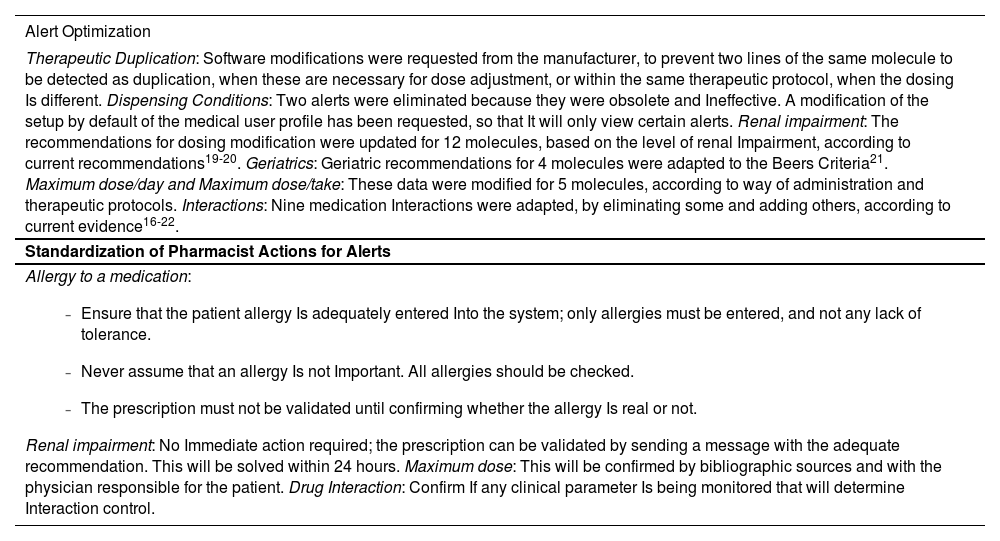
A potential improvement was suggested for each type of alert and molecule, according to the alert generated and its quality. The improvements to be implemented were prioritized according to their feasibility and efficiency, there was a risk evaluation, and consensus was reached in the work team about the measures to be taken. Sixty (60) fields were modified in the alert systems, corresponding to 32 molecules (Table 6).
Improvement actions for the alert system
| Alert Optimization |
|---|
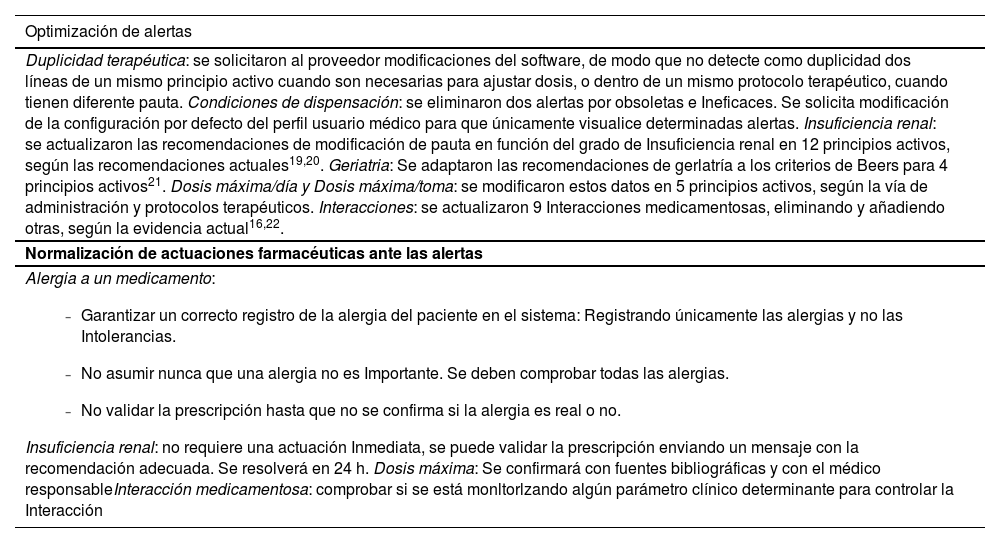
| Therapeutic Duplication: Software modifications were requested from the manufacturer, to prevent two lines of the same molecule to be detected as duplication, when these are necessary for dose adjustment, or within the same therapeutic protocol, when the dosing Is different. Dispensing Conditions: Two alerts were eliminated because they were obsolete and Ineffective. A modification of the setup by default of the medical user profile has been requested, so that It will only view certain alerts. Renal impairment: The recommendations for dosing modification were updated for 12 molecules, based on the level of renal Impairment, according to current recommendations19-20. Geriatrics: Geriatric recommendations for 4 molecules were adapted to the Beers Criteria21. Maximum dose/day and Maximum dose/take: These data were modified for 5 molecules, according to way of administration and therapeutic protocols. Interactions: Nine medication Interactions were adapted, by eliminating some and adding others, according to current evidence16-22. |
| Standardization of Pharmacist Actions for Alerts |
Allergy to a medication:
|
In order to reduce the variability of Pharmacist action when faced with an alert, the work team agreed by consensus on a series of recommendations, which were distributed among Pharmacists (Table 6).
Final situationAfter implementing the improvement actions, there was a re-evaluation of the quantity and quality indicators related to the three months after said implementation. The results of this second evaluation, in comparison with the initial values, are shown in Tables 3 and 4. An important reduction in quantity indicators can be observed, although it is inferior to the 50% initially predefined.
Regarding quality indicators, false positive results were reduced by 25% (difference in proportions=0.25, Cl 95%=0.163-0.337, p<0.05), and the number of inadequate alerts was reduced; because none of the alerts left (due to limitations in the program) were accepted by the user, the 100% of alerts ignored with justification was sustained, and there were no significant differences either in terms of user adherence to the system.
Economic impactThe estimated benefit consists mainly in saving time that can be used for other tasks. The 28% reduction (13,313) in the number of alerts generated allows to estimate that 4.3 hours per month are saved in prescription and validation time. If we also consider that each alert is visualized for a mean of 6 times throughout patient's treatment follow-up, and that each time it is read again, this saving could reach 25.8 hours per month.
End of the projectThe improvements and project results were reviewed and discussed by the work team, and then communicated to healthcare professionals through the hospital intranet by computer graphics (Figure 3).
Discussion
The ideal AEP system would provide information to the user that is perceived as very useful, and achieve the adequate balance between the number of alters and the guarantee of patient safety. Our alert system already features the essential alert categories described in literature, and those characteristics defining a good alert system, such as specificity, sensitivity, clear and justified information, stating severity and the action required, and no interruption of the work flow (only the most important alerts appear in an interactive format).11 However, there is room for improvement. And this article is an approach to real practice, based on user opinion about the alert system, in terms of quantity and quality, in order to suggest measures to reduce alert fatigue.
According to the survey, the majority of prescribers (93%) claim that they read the alerts, but only 30% declare that they always follow their recommendations, which shows system alert fatigue. Prescribing physicians become sceptic regarding the validity of the system, trusting their own knowledge or assumptions, and/or underestimating the potential adverse effects of medications10. In fact, very few users (6%) acknowledge that they have detected some negative consequence by not following the recommendations. This coincides with the results of previous studies, where adverse effects have been detected only for 2.3 to 6% of those alerts ignored3.
Regarding the total number of alerts, even though it was not considered excessive by users, it has been reduced by 28%. Therefore, from visualizing an alert for each 3.6 lines modified, there is now an alert per each 5.1 lines modified. And all this without any negative impact on patient safety, because there is still a 100% proportion of alerts ignored with justification, and only those alerts ignored without justification represent a threat from the point of view of safety.
The most valued alert is that regarding drug allergies; and practically all participants (89%) answers that they would like the line of treatment to be blocked when this type of alert appears. In our case, even though there is high sensitivity, it only generates 2% of the total number of alerts, but still presents false positive results, mainly due to an incorrect record of the history of patient allergies (real allergy vs. lack of tolerance) and/or when the alert is based upon potential cross-sensitivities12,13. The improvement consisted in standardizing pharmacist action at the level of allergy coding and intervention to be conducted.
The renal impairment alert is the third most valued alert, and responsible for 25% of those alerts recorded. The information available has been reviewed and updated, in order to improve its perceived utility.
Four molecules were practically responsible for geriatric alerts, mainly regarding a gradual increase in dose and monitoring in geriatric patients when, in the majority of cases, these medications were already part of their chronic treatment; therefore, it was decided to eliminate these recommendations.
Regarding maximum doses, low adherence has been detected, which can only be corrected through pharmacist intervention.
In terms of interactions, it is known that the sensitivity and specificity of interaction alerts have a high impact on the quality and number of alerts presented. It is recommended to include only those which are clinically relevant and require some action14. The module of interactions has been reviewed and updated, and pharmacist action has been improved. Algorithms must still be introduced that combine the prescription of one or more drugs with lab test data and their adequate range; this would increase the specificity of these alerts, because one of the most frequent reasons to ignore them is the intent to monitor the patient13,15,16. The incorporation of these highly specific algorithms would also allow to alert about other contraindications in general, which is information highly valued by physicians, according to this survey.
All this has achieved a 25% reduction in false positive results; that is to say, there has been an increase in the utility of the alert systems (PPV). But alert fatigue is a complex situation, associated with a human component which determines that the user will read the alert and value its level of utility at the time of making a clinical decision. Therefore, the real impact of reducing the volume of alerts is still to be determined16,17. And even though the number of alerts has been reduced, no improvement has been achieved regarding the level of adherence by the user, who continues eliminating them instinctively. In order to improve this adherence, it will probably be necessary to inform users about these improvements; and this has been done by publishing computer graphics in the hospital intranet, and allowing for a period of adaptation.
Regarding the personal alert setup (question F), very few medical users remember that they can change their profile (after their initial training). Even though this is one of the factors most frequently mentioned in literature as an example of how to optimize the alert systems, in the study by Jung et al. it appears as the aspect least valued by physicians18. And according to the opinion of users in our centre, this is not an option that they consider essential for the improvement of the system.
One step further in order to improve process efficiency has consisted in reviewing the variability in pharmacist action when faced with the alerts. Through a training session we have standardized our action, defining how, when, who, and in which circumstances there must be an intervention.
An important aspect in the future will be to establish the relationship between making clinical decisions by alert and the quality of patient care or health outcomes. In fact, an evolution in AEP system information towards health outcomes is already being demanded14,17.
As a conclusion, there has been a quantitative and qualitative improvement in the alert system, following the LSS methodology. However, continuous maintenance will be required, with iterative refining and function monitoring, in order to ensure an optimal function of these tools for supporting clinical decision, as well as trust by the user and their ability to react when faced with the information offered,
The authors declare that there is no conflict of interests, and that there has been no funding whatsoever for this project.
AcknowledgementsTo Asunción Albert, Manuela Martinez, Emilio Monte, Amparo Perisand Carmen Planells for being partof the work team for the project, and their commitment and advice.
Aportación a la literatura científicaEste trabajo original se planteó con el objetivo de reducir la fatiga por alertas de nuestro sistema de prescripción electrónica asistida, mediante la optimización del número y la calidad de las alertas y la normalización de la actuación farmacéutica ante los diferentes tipos de alertas.
El fenómeno de fatiga por alertas que hemos detectado en nuestra práctica diaria es algo que ocurre frecuentemente con los sistemas de alertas en prescripción electrónica asistida (PEA). Se ha constatado que a pesar de la amplia experiencia y la literatura disponible acerca de la implantación de estos sistemas, todavía se identifican muchas deficiencias. Además, existen pocos estudios sobre su eficacia en cuanto a la pertinencia y la calidad de la información ofrecida, así como sobre la respuesta de los usuarios ante esta información, y todo esto puede comprometer la eficacia y seguridad del sistema.
Pensamos que tanto la originalidad como la relevancia de los resultados radican en la metodología seguida, Lean Six Sigma, que se caracteriza por apoyarse en un grupo de trabajo, es decir, requiere el consenso de los usuarios, y sobretodo que las mejoras se introducen en función de la „voz del cliente“ u opinión de los usuarios. En este sentido, consideramos que hubo un alto nivel de participación (aprox. Un 10 % de los facultativos del hospital).
Esta valoración del sistema de alertas por parte de un gran número de usuarios, junto con el análisis de la calidad de los tipos de alertas más frecuentes y las mejoras introducidas, contribuyen a ir generando una valiosa información sobre la verdadera utilidad de los sistemas de alertas en los programas de PEA.
IntroducciónLos sistemas prescripción electrónica asistida (PEA) constituyen, en el marco de la mejora de la seguridad del paciente, un importante instrumento de soporte para la toma de decisiones clínicas en el momento de la prescripción1.
Estos sistemas se han desarrollado considerablemente en los últimos años de modo que, además de un amplio espectro de información clínica, la mayoría incluye un potente sistema de alertas de seguridad. Sin embargo, existen pocos estudios sobre su eficacia, y no siempre se ha conseguido demostrar los beneficios clínicos que suponen para el paciente2-3,4-5.
Se ha descrito que las alertas generadas en un sistema de PEA son ignoradas hasta en un 49-96% de los casos3. Esto pone de manifiesto un problema de adherencia de los usuarios a las recomendaciones, y una de las principales causas es el elevado número de alertas generadas (entre un 34-90% de las prescripciones), que, además, no siempre son pertinentes, específicas, y de fácil manejo. Todo esto introduce un fenómeno de „fatiga“6.
Peterson y Bates7 describen la „fatiga por alertas“ como „el estado mental resultante de recibir demasiadas alertas que consumen tiempo y energía mental, y que puede ser la causa de que alertas relevantes clínicamente, puedan pasar inadvertidas entre aquellas que no lo son“. Es decir, se produce una desensibilización del usuario, que ignora tanto las no importantes como las que sí lo son, comprometiendo así el objetivo de estas alertas que es la seguridad del paciente.
Nuestro sistema de PEA cuenta con varios niveles de información y seguridad. En primer lugar proporciona información básica que facilita la prescripción. En segundo lugar realiza un chequeo básico de la prescripción sobre una base de conocimiento de referencia (pautas definidas, dosis máximas, número máximo de días de tratamiento, interacciones, contraindicaciones y duplicidades). Y por último, incluye un chequeo avanzado que integra datos relevantes del paciente como antecedentes alérgicos y determinadas condiciones clínicas, incluso algoritmos de decisión, como el módulo de insuficiencia renal para el ajuste de la pauta de los medicamentos que lo requieren y la dosificación en función del peso corporal y/o edad en los pacientes pediátricos. Todo esto genera alertas que aparecen de forma interactiva y/o a modo de informe al final de la prescripción (esta opción es configurable por usuario en función de sus preferencias y experiencia). Pero en ningún caso se bloquea la prescripción ni existe obligación de justificar la decisión de ignorar la alerta, con lo que no se obtiene la retroalimentación necesaria para la actualización del sistema1.
A pesar de ello, y de que se ha realizado una selección de alertas clínicamente significativas y su parametrización en función de la situación clínica del paciente y de la gravedad de los eventos adversos, se ha constatado el fenómeno de fatiga por alertas en nuestra práctica diaria. Por consiguiente es necesario mejorar la eficiencia del sistema de alertas, reduciendo la carga de trabajo, pero sin menoscabar la seguridad para el paciente.
Estas mejoras requieren el consenso de los usuarios y un compromiso clínico, se deben introducir con precaución y evaluar los resultados. Así pues, este proyecto se ha desarrollado siguiendo la metodología Lean Six Sigma (LSS) que, aunque no está muy extendida en el ámbito sanitario, cuenta ya con alguna experiencia de éxito8. En efecto, es una metodología de mejora continua de calidad, científica, que se apoya en un grupo de trabajo y entiende las necesidades del cliente. La idea clave es aplicar las herramientas de Lean para eliminar etapas innecesarias, que no aportan valor (desperdicios) y reducir tiempos de ciclo (eficiencia), así como las técnicas de Six Sigma para reducir la variabilidad y los defectos (efectividad y seguridad)9.
El presente trabajo tiene como objetivo optimizar el número y la calidad de las alertas de nuestro programa de PEA, normalizar la actuación de los farmacéuticos ante los diferentes tipos de alertas y aumentar la satisfacción de los usuarios.
MétodosAspectos éticosEl proyecto fue autorizado por la Jefatura de Servicio („Champion“ según la metodología LSS). Los registros electrónicos no incluyeron datos de identificación de pacientes ni de profesionales.
DiseñoEstudio observacional, transversal y retrospectivo. Se implementaron mejoras y evaluaron resultados mediante el despliegue de las etapas del ciclo DMAIC de la metodología LSS (siglas en inglés: Define, Measure, Analyze, Improve, Control)9.
ÁmbitoHospital general y de referencia con 1.000 camas de hospitalización, 850 de ellas con PEA, con más de 1.000 licencias de facultativos prescriptores y 1.450 especialidades farmacéuticas disponibles en el sistema para la prescripción.
Población y muestraSe incluyeron las alertas generadas durante dos trimestres de estudio (pre y post-intervención), obtenidas del sistema de PEA. Para el análisis cualitativo del proyecto se revisaron un total de 496 prescripciones.
Planificación del ciclo DMAICEl proyecto LSS se desarrolló entre mayo 2014 y mayo 2015. Se estructuró en las etapas del ciclo DMAIC.
En la etapa Definir (Define) (mayo-junio 2014), se definió el problema, el objetivo, el grupo de trabajo, y el cronograma del proyecto. El Grupo de trabajo estuvo constituido por cinco usuarios del sistema de PEA (4 farmacéuticos y 1 médico), un médico observador externo, un farmacéutico de apoyo metodológico y el farmacéutico gestor de la base de datos del sistema de PEA, enlace del grupo.
Según la metodología LSS, el primer paso es conocer la „Voz del cliente“ sobre el sistema de alertas del programa. Para ello se diseñó una encuesta con seis preguntas sobre la cantidad y calidad de las alertas, así como la actitud ante las mismas, que se distribuyó entre todos los usuarios médicos y farmacéuticos (facultativos especialistas y residentes). La encuesta fue totalmente anónima, aunque incluía datos del servicio clínico y la categoría profesional.
A partir del análisis de la voz del cliente se determinaron las „características críticas“ (metodología LSS) del proyecto y se definieron los indicadores cuantitativos y cualitativos a medir (Tabla 1).
Características críticas derivadas de la voz del cliente e indicadores cuantitativos y cualitativos
| Característica crítica | Indicador | Criterio | Métrica | |
|---|---|---|---|---|
| INDICADORESCUANTITATIVOS | Cantidad de alertas | Alertas por paciente y por Ingreso | N° alertas únicas que aparecen por paciente y por Ingreso | Ratio |
| Alertas por cada línea modificada | N° alertas que aparecen por cada línea de medicamento prescrlta/modlflcada | Ratio | ||
| INDICADORES CUALITATIVOS | Leer las alertas | Falta de adherencia | % alertas Ignoradas respecto de las apropiadas | Ratio |
| Seguir las recomendaciones de las alertas | Alertas Ignoradas de forma justificada | % alertas Inapropiadas Ignoradas respecto de las Inapropiadas | Ratio | |
| Consecuencias por no seguir las recomendaciones | Falsos positives. Especificidad | % alertas Inapropiadas respecto del total | Ratio | |
| Valor predlctlvo positivo (VPP) | % alertas apropiadas respecto del total | Ratio |
En las etapas Medir y Analizar (Measure, Analyze) (julio-septiembre 2014), se cuantificaron las alertas generadas durante el primer trimestre del 2014, el número de pacientes ingresados y el número de líneas de prescripción modificadas durante ese periodo.
Para medir los indicadores cualitativos, se recurrió al análisis de los tipos de alerta más frecuentes y de los principios activos responsables de más del 50% de cada tipo de alerta. Se analizó una muestra de las prescripciones que generaron estas alertas, desde el punto de vista de la pertinencia de la alerta (ser apropiada o no) y de la actuación clínica ante estas alertas, aceptarla o no (Figura 1).

La actuación farmacéutica ante las alertas más valoradas por los médicos, se evaluó mediante una segunda encuesta.
En la etapa Mejorar (Improve), (octubre-diciembre 2014), se planteó eliminar y modificar alertas que no aportaban valor según criterios definidos de un buen sistema de alertas3,6,10. Para ello, se priorizaron y consensuaron las mejoras a implementar en el grupo de trabajo. Se estableció como objetivo inicial reducir a la mitad la carga de alertas.
Con objeto de reducir la variabilidad de la actuación farmacéutica frente a los distintos tipos de alertas se propuso una serie de recomendaciones al equipo farmacéutico.
En la etapa Controlar (Control) (enero-mayo 2015), se reevaluaron los indicadores a partir de datos extraídos del sistema de PEA correspondientes al primer trimestre de 2015, una vez implementadas las mejoras.
Se estimó el beneficio de la reducción del número de alertas en base a la aproximación de que el tiempo necesario para leer una alerta es de 1,7 segundos.
Análisis estadísticoSe sometieron los resultados a la prueba de análisis estadístico z de comparación de dos proporciones. El nivel de significación establecido fue de 5%. El análisis se realizó con el programa de análisis estadísticos G-Stat 2.0.
ResultadosEncuesta (voz del cliente)Se recogieron 136 encuestas, correspondientes a 24 servicios clínicos, tanto médicos como quirúrgicos. El 69% de los encuestados fueron adjuntos y el 31 % residentes. Los resultados de la encuesta se muestran en la tabla 2.
Resultados de la encuesta (voz del cliente) sobre el sistema de alertas (n = 136)
| A | Cuando aparecen las alertas de prescripción en el programa de PEA, ¿Las lee? En caso afirmativo, ¿a qué alertas les presta más atención?(siendo 1 poco y 10 mucho) | Sí = 93%Alergias, (X¯=9,6± 1,0)Contraindicaciones (X¯=8,7 ± 1,8)Insuficiencia renal (X¯=8,1 ±2,0)Interacciones (X¯=8,0± 1,9)Duplicidad (X¯=7,9±2,6)Dosis máximas (X¯=7,4±2,5) |
| B | ¿Sigue las recomendaciones de las alertas? | Nunca = 0%Rara vez = 7%A veces = 63%Siempre = 30% |
| C | ¿Ha detectado alguna consecuencia por no seguir las recomendaciones?¿ En qué tipo de alerta? | Sí = 6%Posologia (n = 2), Insuf. Renal (n =2), Alergias (n = 2), Interacciones (n = 1)Días tratamiento (n = 1) |
| D | ¿En qué tipo de alerta le gustaría que se bloqueara la línea de tratamiento ligada a la alerta? | Alergia: 89%Interacciones: 10%Dosis máxima: 10%, Contraindicaciones: 4%Insuficiencia Renal: 4%. |
| E | ¿Cuál es su opinión acerca de las alertas que actualmente aparecen en el programa de PEA? Pertinencia(¿las alertas que aparecen son las que deben salir?)Recomendación alerta(¿el texto con las recomendaciones propuestas es correcto?Cantidad(¿el número de alertas que aparecen es adecuado?(Siendo „Insuficiente“ 1, „correcta“2y „excesiva“3.) | Sí = 84 %Sí = 86 %X¯ = 2,3±0,5 |
| F | ¿Sabe que puede cambiar la configuración personal de las alertas para que le aparezcan únicamente las que más le Interesen? | Sí (médlcos) = 4 % |
X¯ = media aritmética desviación estándar
Estos resultados se tradujeron en las características críticas del proyecto, y para cada una se definió su indicador, con su criterio y métrica (Tabla 1).
Situación inicialEn el primer trimestre de 2014 se contabilizaron 47.994 alertas diferentes y su distribución porcentual por tipo de alerta se muestra en la figura 2.

Los resultados de los indicadores cuantitativos se recogen en la tabla 3.
Indicadores cuantitativos
| Situación inicial (n) | Situación final (n) | Diferencia | Impacto porcentual | Objetivo inicial | |
|---|---|---|---|---|---|
| VARIABLES | |||||
| N° total de alertas | 47.994 | 34.682 | -13.312 | -28% | - |
| N° total de vlsuallzadones | 305.998 | 204.432 | -101.566 | -33% | - |
| N° vlsuallzaclones/alerta | 6,4 | 5,9 | -0,4 | ||
| N° pacientes Ingresados | 17.961 | 18.853 | - | ||
| N° líneas modificadas | 172.307 | 177.058 | - | ||
| INDICADORES | |||||
| N° alertas/paclente/lngreso | 2,7 | 1,8 | -0,9 | -33% | - 50% |
| N° alertas/línea modificada | 0,3 | 0,2 | -0,1 | -33% | - 50% |
Para el cálculo de los indicadores de calidad se seleccionaron 71 de 971 principios activos (7,3%), responsables de más de la mitad de las alertas generadas en cada tipo de alerta (58%). Tras la evaluación de cada tipo de alerta, se pudieron agrupar en dos tipos:
- -
Aquellas que se debían a limitaciones del software: duplicidad terapéutica, condiciones de dispensación y alergias.
- -
Aquellas que suponían un problema en la calidad de la alerta o en la actuación del usuario, como alertas de insuficiencia renal, geriatría, dosis máximas o interacciones. Para su análisis se revisaron un total de 269 prescripciones y se calcularon los indicadores de calidad definidos (Tabla 4).
Tabla 4.Indicadores de calidad
Tipo de alerta Número (n) Falsos positivos (%) Ignoradas justificadas (%) Falta adherencia (%) Inicio Final Inicio Final Inicio Final Inicio Final Insuficiencia renal 128 106 70 61 100 100 59 57 Geriatria 50 19 97 79 100 100 100 100 Dmáx/día 27 25 33 0 100 — 88 100 Dmáx/toma 30 23 50 0 100 100 100 100 Interacciones 34 54 0 0 — — 33 63 TOTAL 269 227 60,2∗ 35,1∗ 100,0∗ 100,0∗ 70,8∗ 71,1∗ ∗Valores ponderados por tamaño de muestra (n)
Los resultados de la encuesta sobre la actuación farmacéutica ante las alertas valoradas por los médicos como más relevantes, que se distribuyó entre 19 farmacéuticos (5 residentes, 14 adjuntos), se muestran en la tabla 5.
Encuesta sobre actuación farmacéutica ante las alertas más valoradas por los médicos (n=19)
| A | ALERGIAS | ACTUACIÓN | En caso de NO LOCALIZAR al médico prescriptor |
|---|---|---|---|
| Ante un nuevo ingreso, ¿compruebas y registras siempre las alergias en el programa de PEA? | Sí = 84% | ||
| ¿Y las Intolerancias? | Sí = 36,8% | ||
| ¿Consideras que todas las alergias tienen la misma Importancia?¿ Cuál es tu actuación? | Sí = 47,4%No hago nada = 11 %Llamo al médlco = 89% | Valido tratamlento = 47%No valido tratamlento = 53% | |
| B | INSUFICIENCIA RENAL | ||
| ¿Registras siempre las creatlnlnas alteradas en el programa de PEA? | Sí = 36,8% | Valido tratamlento = 47% No valido tratamlento = 21 % No contesta = 32% | |
| Ante una alerta de Insuficiencia renal, ¿cuál es tu actuación? | No hago nada = 26% Envío mensaje = 63% Llamo al médlco= 11 % | ||
| C | DOSIS MÁXIMA | ||
| Ante una alerta de dosis máxima, ¿cuál es tu actuación? | Confirmo con la bibliografía y llamo o envío mensaje: 100% | Valido tratamlento = 26% No valido tratamlento = 63% No contesta = 11 % | |
| E | INTERACCIONES | ||
| ¿Considera que todas las Interacciones tienen la misma Importancia? | Sí=5,3 % | Valido tratamlento = 53%No valido tratamlento = 37%No contesta = 10% | |
| ¿Cuál es tu actuación? | No hago nada = 0% Envío mensaje = 68% Llamo al médlco = 32% |
Para cada tipo de alerta y principio activo se planteó una posible mejora de acuerdo con la alerta generada y la calidad de la misma. Se priorizaron las mejoras a implementar en función de su factibilidad y eficiencia, se evaluaron riesgos y se consensuaron las medidas a tomar en el grupo de trabajo. Se modificaron 60 campos del sistema de alertas, correspondientes a 32 principios activos (Tabla 6).
Acciones de mejora en el sistema de alertas
| Optimización de alertas |
|---|
| Duplicidad terapéutica: se solicitaron al proveedor modificaciones del software, de modo que no detecte como duplicidad dos líneas de un mismo principio activo cuando son necesarias para ajustar dosis, o dentro de un mismo protocolo terapéutico, cuando tienen diferente pauta. Condiciones de dispensación: se eliminaron dos alertas por obsoletas e Ineficaces. Se solicita modificación de la configuración por defecto del perfil usuario médico para que únicamente visualice determinadas alertas. Insuficiencia renal: se actualizaron las recomendaciones de modificación de pauta en función del grado de Insuficiencia renal en 12 principios activos, según las recomendaciones actuales19,20. Geriatria: Se adaptaron las recomendaciones de gerlatría a los criterios de Beers para 4 principios activos21. Dosis máxima/día y Dosis máxima/toma: se modificaron estos datos en 5 principios activos, según la vía de administración y protocolos terapéuticos. Interacciones: se actualizaron 9 Interacciones medicamentosas, eliminando y añadiendo otras, según la evidencia actual16,22. |
| Normalización de actuaciones farmacéuticas ante las alertas |
Alergia a un medicamento:
|
Para reducir la variabilidad de la actuación farmacéutica ante una alerta, se distribuyó entre los farmacéuticos una serie de recomendaciones consensuadas en el grupo de trabajo (Tabla 6).
Situación finalTras aplicar las acciones de mejora, se reevaluaron los indicadores de cantidad y calidad correspondientes a los tres meses siguientes a su implantación. Los resultados de esta segunda valoración, comparados con los iniciales se muestran en las tablas 3 y 4. Se observa una importante reducción de los indicadores de cantidad aunque inferior al predefinido inicialmente del 50%.
En cuanto a los indicadores de calidad se redujeron los falsos positivos en un 25% (diferencia de proporcio- nes=0,25, IC 95% = 0,163-0,337, p<0,05), se redujo el número de alertas inapropiadas, pero dado que ninguna de las que quedaron (por limitaciones del programa) fueron aceptadas por el usuario, se mantuvo el 100% de alertas ignoradas de forma justificada, y tampoco hubo diferencias significativas en la adherencia de los usuarios al sistema.
Impacto económicoEl beneficio estimado consiste fundamentalmente en un ahorro de tiempo que podrá ser empleado en otras tareas. La reducción de un 28% (13.313) en el número de alertas generadas permite estimar un ahorro de 4,3 h/ mes en tiempos de prescripción y validación. Si además consideramos que cada alerta se visualiza una media de 6 veces durante todo el seguimiento del tratamiento del paciente, y que cada vez se vuelve a leer, el tiempo ahorrado podría ser de 25,8 h/mes.
Cierre del proyectoLas mejoras y los resultados del proyecto fueron revisados y debatidos por el grupo de trabajo y se comunicaron a los profesionales sanitarios a través de la intranet del hospital mediante una infografía (Figura 3).
Discusión
Un sistema de PEA ideal sería el que proporciona al usuario información que percibe como muy útil y que consigue el equilibrio adecuado entre el número de alertas y la garantía de la seguridad del paciente. Nuestro sistema de alertas ya cuenta con las categorías de alertas fundamentales descritas en la bibliografía y con características que definen un buen sistema de alertas, como especificidad, sensibilidad, información clara y justificada, indicando la gravedad y acción necesaria, y no interrumpir el flujo de trabajo (solo aparecen de forma interactiva las alertas más importantes)11. Sin embargo, existen posibilidades de mejora. Y el presenta trabajo es una aproximación a la práctica real, ya que se basa en la opinión del usuario acerca del sistema de alertas, en términos de cantidad y calidad, y a partir de ahí se plantean medidas para reducir la fatiga por alertas.
Según la encuesta, la mayoría de los prescriptores afirma leer las alertas (93%), pero sólo un 30% de ellos declara seguir siempre sus recomendaciones lo que demuestra una fatiga por alertas en el sistema. Los prescriptores se vuelven escépticos en cuanto a la validez del sistema, confiando en sus propios conocimientos y asunciones y/o infraestimando los potenciales efectos adversos de los medicamentos10. De hecho, muy pocos usuarios (6%) reconocen haber detectado alguna consecuencia negativa por no seguir las recomendaciones. Esto coincide con los resultados de estudios previos, en los que se han detectado efectos adversos sólo entre 2,3-6% de las alertas ignoradas3.
En lo referente a la cantidad total de alertas, aunque no se consideraba del todo excesiva por los usuarios, se ha reducido el número total en un 28%. De modo que se ha pasado de visualizar una alerta por cada 3,6 líneas modificadas a una alerta por cada 5,1 líneas modificadas. Y todo esto sin afectar a la seguridad del paciente, ya que la proporción de alertas ignoradas de forma justificada se mantiene en el 100% y sólo las alertas ignoradas injustificadamente constituyen una amenaza desde el punto de vista de la seguridad.
La alerta más valorada es la referente a alergias medicamentosas, y prácticamente la totalidad de los encues- tados (89%) responde que le gustaría que se bloqueara la línea de tratamiento ante una alerta de este tipo. En nuestro caso, aunque la sensibilidad es muy elevada, apenas genera el 2% del total de las alertas, pero sigue presentando falsos positivos, fundamentalmente por un registro incorrecto de los antecedentes alérgicos del paciente (verdadera alergia frente a intolerancia) y/o cuando la alerta se basa en potenciales sensibilidades cruzadas12,13. La mejora consistió en estandarizar la actuación farmacéutica a nivel de la codificación de la alergia y la intervención a realizar.
La alerta de insuficiencia renal, es la tercera alerta más valorada, y responsable del 25% de las alertas registradas. Se ha revisado y actualizado la información disponible para mejorar su utilidad percibida.
Prácticamente cuatro principios activos eran los responsables de las alertas de geriatría, que hacían referencia fundamentalmente al aumento gradual de las dosis y monitorización en pacientes geriátricos, cuando, en la mayoría de los casos, estos medicamentos ya formaban parte del tratamiento crónico del paciente, por lo que se decidió eliminar estas recomendaciones.
En cuanto a las dosis máximas, se detecta una baja adherencia que solo se corrige con la intervención por parte del farmacéutico.
Respecto a las interacciones, se sabe que la sensibilidad y especificidad de las alertas de interacciones tienen un alto impacto en la calidad y número de alertas presentadas. Se recomienda incluir únicamente aquellas clínicamente relevantes y que requieren una actuación14. Se ha revisado y actualizado el módulo de interacciones, y mejorado la actuación farmacéutica. Queda pendiente la introducción de algoritmos que combinen la prescripción de uno o más fármacos con el registro de un dato analítico y los límites permitidos de éste, con lo que se conseguiría aumentar la especificidad de estas alertas, ya que una de las razones más habituales para ignorarlas es la intención de monitorizar al paciente13,15,16. La incorporación de estos algoritmos altamente específicos permitiría también alertar sobre otras contraindicaciones en general, información muy valorada por los médicos como se desprende de la encuesta.
Con todo se ha conseguido reducir en un 25% los falsos positivos, es decir, se ha incrementado la utilidad del sistema de alertas (VPP). Pero la fatiga de alertas es un fenómeno complejo, que lleva asociado un componente humano que determina el que el usuario lea la alerta y valore el grado de utilidad en el momento de tomar una decisión clínica. Por lo que el impacto real de reducir el volumen de alertas está por determinar16, 17. Así pues, a pesar de reducir el número de alertas no se ha logrado mejorar el grado de adherencia del usuario, que sigue anulándolas instintivamente. Probablemente para mejorar esta adherencia sea necesario informar de las mejoras a los usuarios, y se ha hecho a través de la publicación de una infografía en la intranet del hospital, y dejar un periodo de adaptación.
En cuanto a la configuración personal de alertas (pregunta F), muy pocos usuarios médicos recuerdan (tras una formación inicial) que la pueden cambiar. A pesar de que es uno de los factores que más se nombra en la literatura como ejemplo de cómo optimizar el sistema de alertas, en el estudio de Jung et al., es el aspecto menos valorado por los médicos18. Y atendiendo a la opinión de los usuarios en nuestro centro, tampoco es una opción que consideren fundamental para la mejora del sistema.
Un paso más para mejorar la eficiencia del proceso ha consistido en revisar la variabilidad de la actuación farmacéutica ante las alertas. Así, mediante una sesión formativa hemos normalizado nuestra actuación, definiendo cómo, cuándo, quien y en qué circunstancias se debe intervenir.
Un aspecto importante para un futuro será establecer la relación entre la toma de decisiones clínicas por la alerta y la calidad de la atención o resultados en salud. De hecho, ya se está reclamando de los sistemas de PEA una evolución de la información a resultados en salud14,17.
En conclusión, se ha mejorado cuantitativa y cualitativamente el sistema de alertas, siguiendo la metodología LSS.
Si bien, para garantizar el funcionamiento óptimo de estas herramientas de soporte a la decisión clínica, la confianza del usuario y su capacidad de reacción ante la información ofrecida, es necesario un mantenimiento continuo, con un refinamiento iterativo y monitorización de su funcionamiento.
Los autores declaran no tener conflicto de intereses, ni haber obtenido financiación alguna para este proyecto.
AgradecimientosA Asunción Albert, Manuela Martínez, Emilio Monte, Amparo Peris y Carmen Planells por su pertenencia al grupo de trabajo del proyecto, dedicación y asesoramiento.


Farmacia Hospitalaria sigue las recomendaciones para la preparación, presentación y publicación de trabajos académicos en revistas biomédicas
- Inicio
- Todos los contenidos
- Publique su artículo
- Acerca de la revista
- Métricas